


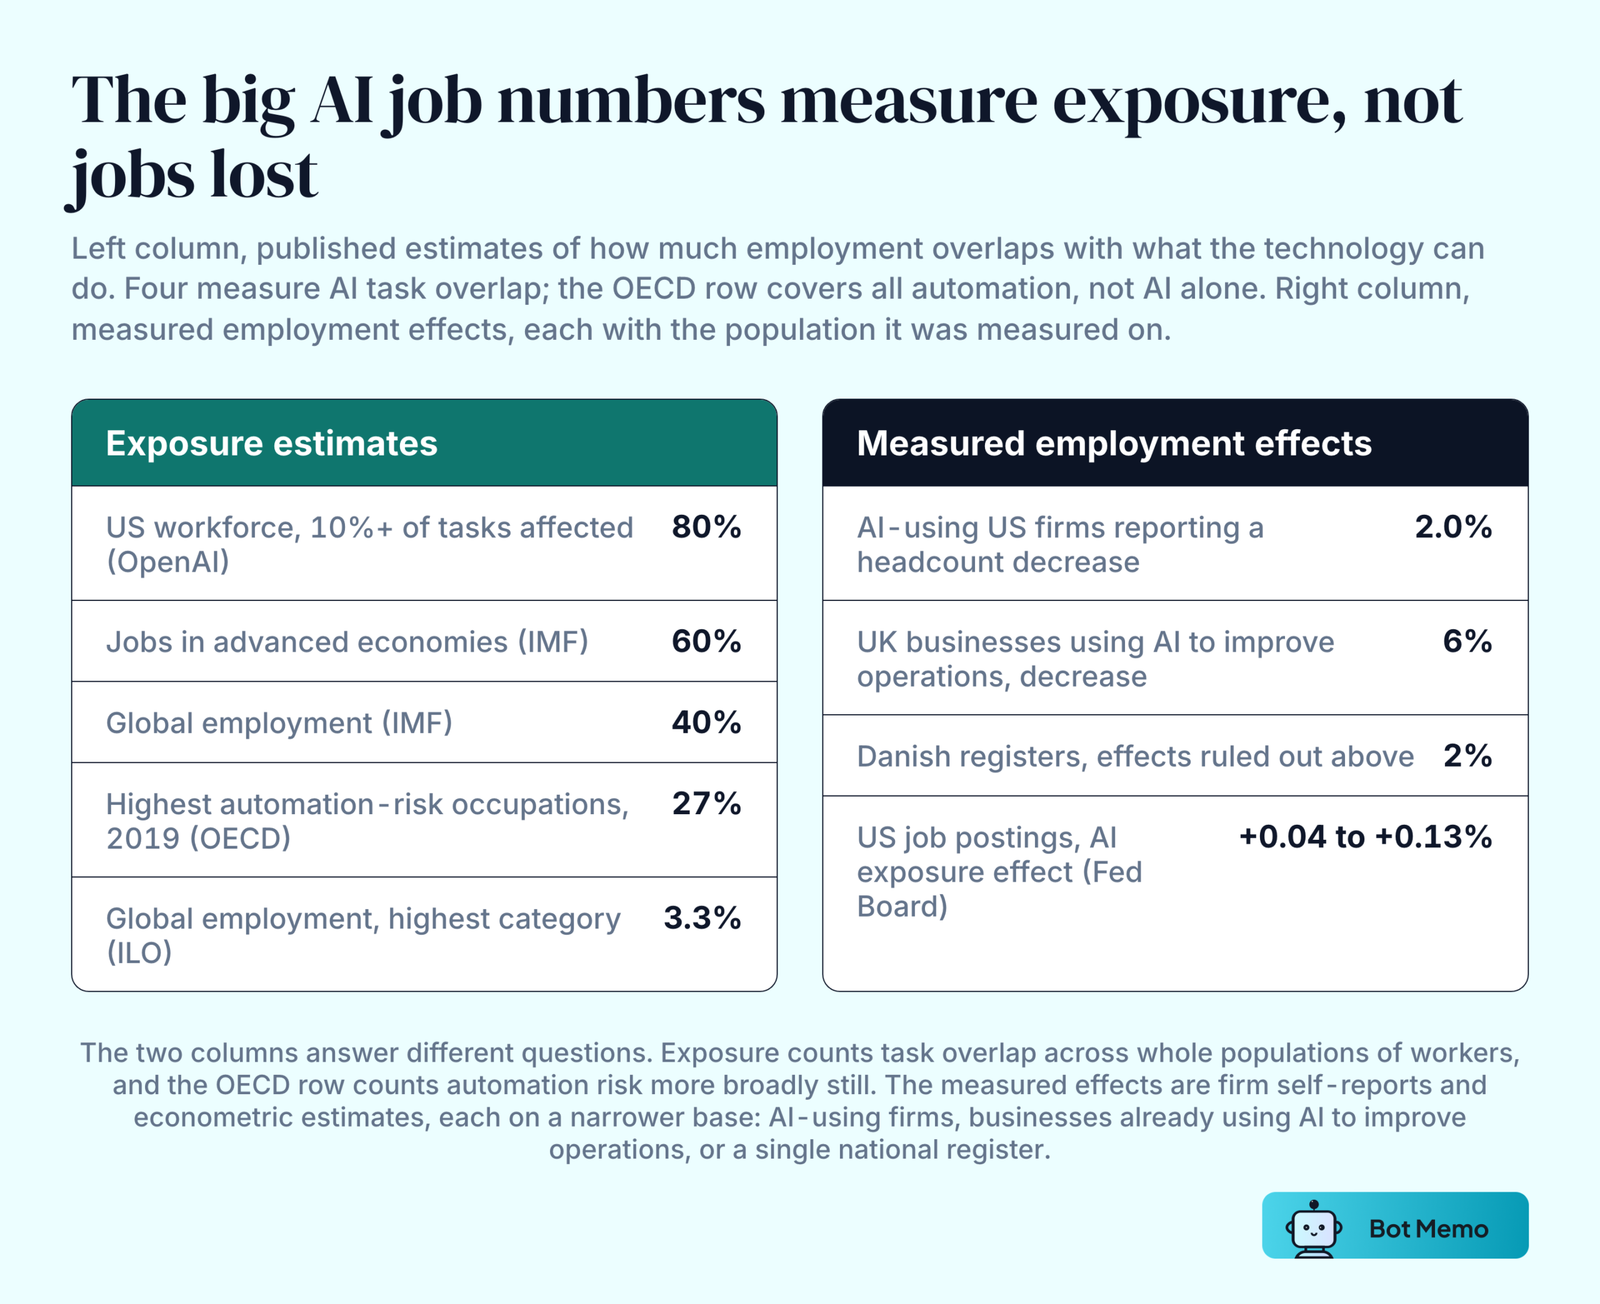
No official statistic counts US jobs lost to AI, and the studies looking for economy-wide displacement mostly find nothing. Danish administrative registers rule out effects larger than 2% on earnings and hours, and about 2.0% of AI-using US firms report a headcount decrease.
Three things get confused in almost every set of AI job replacement statistics: how many jobs are exposed to the technology, how many have actually gone, and how many jobs AI is forecast to replace by 2030. They are different measurements, and mixing them produces numbers that mean nothing.
The huge numbers in circulation measure something else. The IMF’s 40% and OpenAI’s 80% describe how much of a job’s tasks overlap with what the technology can do, not how many jobs have gone.
On this page
- How Many Jobs Has AI Replaced So Far?
- How Many Jobs Will AI Replace? The Exposure Estimates
- AI Job Loss Projections For 2030 And 2035
- Which Jobs Are Most Likely To Be Replaced By AI
- AI Adoption By Businesses, And The Job Losses They Report
- How Workers Feel About AI Replacing Their Jobs
- The New Jobs AI Creates
- Key Takeaways
- Frequently Asked Questions
- Sources And Methodology
How Many Jobs Has AI Replaced So Far?
No official statistic counts US jobs lost due to AI. The research looking for evidence that AI is replacing jobs is newer and far less quoted than the forecasts, and it mostly finds small effects, with one loud exception.
Economy-Wide Displacement Has Not Shown Up In The Data
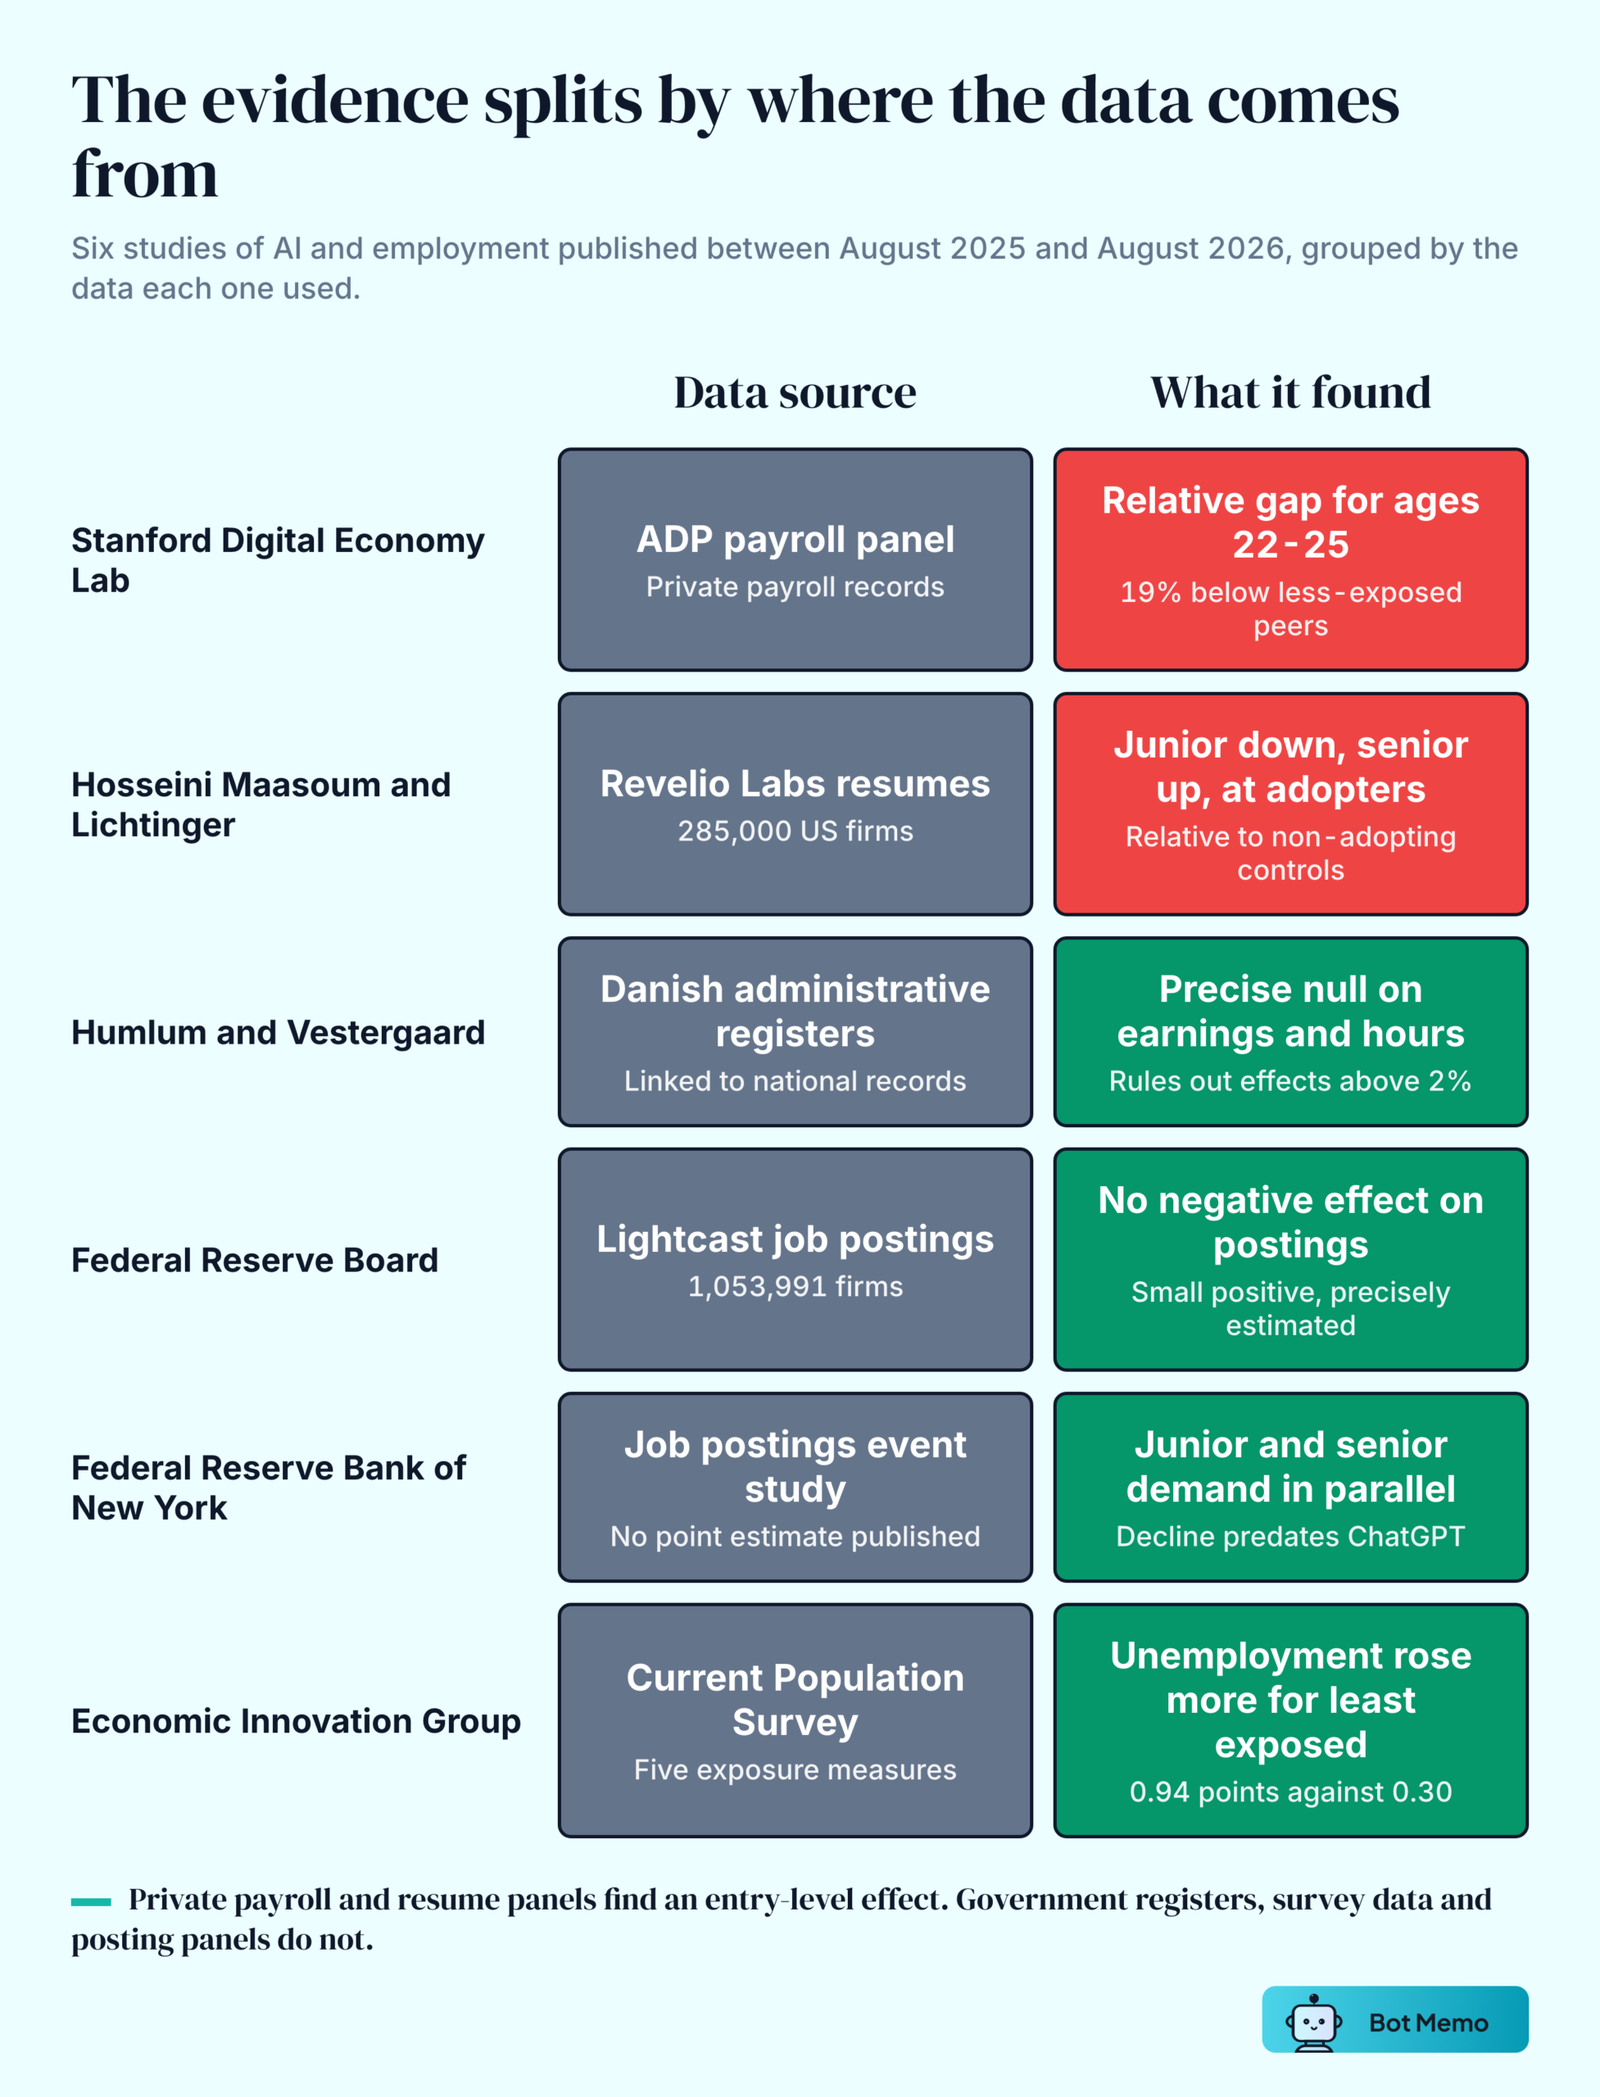
1. The Stanford Digital Economy Lab finds no evidence of widespread, economy-wide job displacement. That is the first of the six facts in Brynjolfsson, Chandar and Chen’s Canaries in the Coal Mine?, August 2026 revision, built on ADP payroll records through June 2026.
2. The Yale Budget Lab found no discernible disruption in the broader labor market 33 months after ChatGPT’s release. Its October 2025 report with Brookings Metro benchmarks the occupational mix against the start of the computer wave in 1984 and the internet wave in 1996.
3. Yale found that exposure, automation and augmentation measures show no sign of being related to changes in employment or unemployment. The same report notes that OpenAI’s exposure data and Anthropic’s usage data have only a limited correlation with each other, which means the choice of exposure measure drives the answer.
4. The Federal Reserve Board found no negative effect on job postings, and a small positive one. Liu and Webber’s March 2026 FEDS Note put the estimate between 0.04% and 0.13% across 1,053,991 firms and 72 industries, September 2023 to November 2025, and called the results precisely estimated null effects.
Young Workers Are The One Group Where A Gap Appears
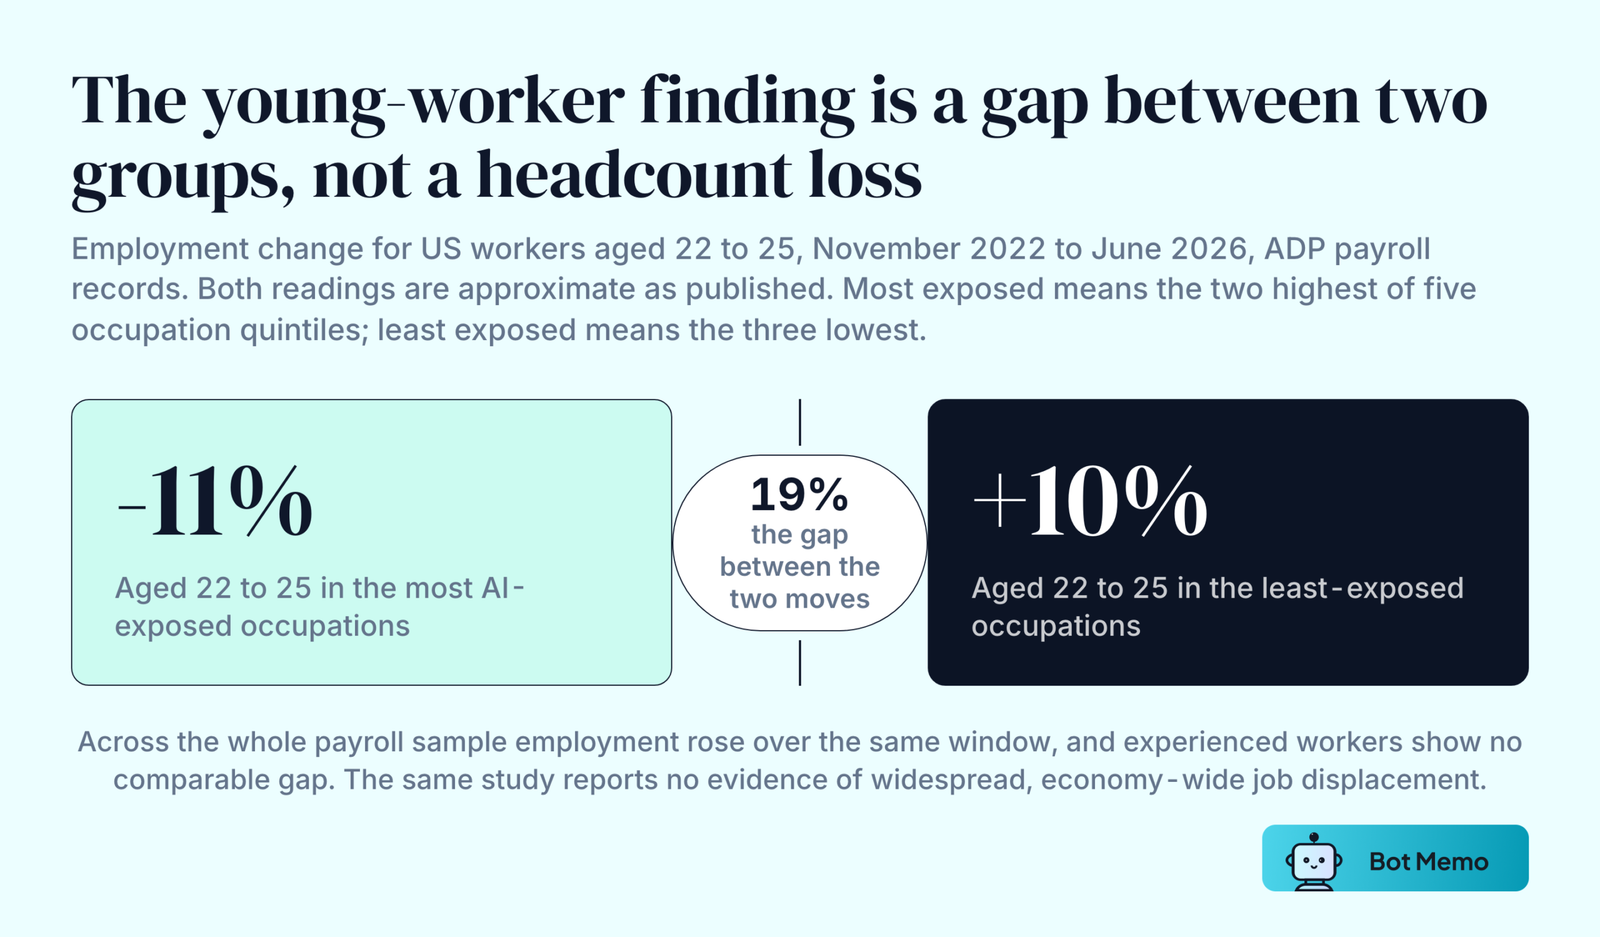
5. Employment of 22 to 25 year olds in AI-exposed occupations sits 19% below where it would be had it kept pace with their less-exposed peers. The comparison group is the whole finding: the two most exposed occupation quintiles measured against the three least exposed, not an economy-wide job count.
6. Inside the ADP sample, employment of 22 to 25 year olds in the two most exposed occupation groups fell about 11% between November 2022 and June 2026. An absolute decline, for that cohort, in that payroll panel.
7. Employment for their least-exposed peers grew about 10% over the same window. The 19% is the gap between those two moves.
8. Across the whole ADP sample, employment rose about 6%, while the most exposed quintile grew about 4%. That all-ages cut shows both groups growing, which the young-worker cut does not.
9. The Stanford headline has been 13%, 15%, 16% and 19% across versions. Earlier versions headlined regression estimates adjusting for firm-level shocks (13% on July 2025 data, 16% on September 2025 data) before the authors moved to the simpler descriptive divergence. Citing the number without naming the vintage and the estimator misstates the paper.
10. Experienced workers show no comparable gap. They act as the placebo in the same analysis, which is what separates the young-worker result from a general story about a weak labor market.
A Resume Panel Finds Entry-Level Jobs Hit At Adopting Firms
11. Junior employment at AI-adopting firms fell relative to non-adopting controls from the first quarter of 2023, while senior employment kept rising. Hosseini Maasoum and Lichtinger of Harvard, Generative AI as Seniority-Biased Technological Change, using US resume and job posting data covering 65 million workers at more than 280,000 firms.
Coefficients for junior workers are flat and indistinguishable from zero through the end of 2022, then turn sharply negative.
12. The October 2025 version of that paper puts the six-quarter decline at about 9%. The magnitude has moved across versions of the working paper, which was last revised in June 2026, so the direction of the finding is firmer than its size. The authors state that adopting firms differ systematically in size, workforce composition and industry, and that unobserved confounders may remain.
National Registers And Posting Panels Find Nulls
13. Danish administrative registers rule out effects larger than 2% on earnings and hours two years after ChatGPT launched. Humlum and Vestergaard’s Still Waters, Rapid Currents, dated 13 March 2026, links two adoption surveys covering roughly 25,000 workers at roughly 7,000 workplaces to national records. The July 2025 version of the same paper ruled out effects above 1%.
14. Their bound on the entry-level story is 0.14 percentage points against a baseline early-career share of about 8%. That is the edge of their confidence interval, not a point estimate. They replicate the declining early-career pattern in Denmark and find it is not driven by firms adopting AI.
15. Danish workers using chatbots report time savings of about 3% of work hours. Randomized trials in the same occupations have reported gains often exceeding 15%. The July 2025 version of the paper put the saving at 2.8%, which is the figure still in circulation.
16. The New York Fed found junior and senior postings in highly exposed occupations moving broadly in parallel. Audoly, Guerin and Topa’s May 2026 Liberty Street post also notes that the posting decline in exposed occupations began before ChatGPT’s late-2022 release. The post publishes no point estimate for that result.
17. Fewer than 10% of US workers and vacancies sit in occupations with AI exposure of at least 0.4, and 40% of workers are in jobs with zero measured exposure. From the same New York Fed post.
The OECD reaches the same place in Employment Outlook 2026, July 2026, covering Australia, Canada, the EU and the US: generative AI may have begun to automate certain jobs, but the data show little evidence of it to date.
On young workers the OECD is blunter. The role of large language models in explaining their difficulties appears limited, the graduate unemployment gap was already widening before firms adopted the technology, and postings in high-exposure occupations show no break at the end of 2023. The OECD calls that conclusion preliminary.
18. Unemployment rose more for the least exposed workers than the most exposed. The Economic Innovation Group’s AI and Jobs, August 2025, reports a 0.30 percentage point rise for the most exposed quintile between 2022 and early 2025, against 0.94 points for the least exposed. Under two of their five exposure measures a small adverse gap does appear, around 0.2 and 0.3 points; their preferred measure shows none.
How Many Jobs Will AI Replace? The Exposure Estimates
Every figure in this section measures technical overlap between what AI models can do and what an occupation involves. None of them counts a job being lost, and the organizations that publish them say so. Read as a share of jobs that could be replaced by AI, each one is wrong by construction.
The IMF Puts Global Exposure Near 40%
19. Almost 40% of global employment is exposed to AI. From the IMF’s Gen-AI: Artificial Intelligence and the Future of Work, Staff Discussion Note SDN/2024/001, January 2024.
20. In advanced economies the figure is about 60%, because cognitive-task jobs are more common there. Exposure is 40% in emerging market economies and 26% in low-income countries.
21. About half of that advanced-economy 60% may be negatively affected; the rest could see productivity gains. The IMF defines exposure as the degree of overlap between AI applications and required human abilities, which is not the same as substitutability.
The ILO Revised Its Own Index Downward
22. One in four workers globally is in an occupation with some generative AI exposure. ILO Working Paper 140, 20 May 2025, built on 29,753 tasks, a survey of 1,640 employed people and expert review rounds.
23. 3.3% of global employment falls into the highest exposure category. Split by sex, that is 4.7% of female employment and 2.4% of male employment.
24. The highest-exposure share runs from 11% of employment in low-income countries to 34% in high-income countries. The ILO’s revised estimates are lower than the ones in its 2023 paper.
25. Clerical work is the only broad occupation group the ILO finds highly exposed, at 24% of clerical tasks. Another 58% of clerical tasks carry medium exposure. Note the denominator: tasks within clerical support, not workers and not all employment. From Working Paper 96, August 2023.
26. For every other occupational group, the highest-exposure task share runs between 1% and 4%. The same paper puts potentially exposed employment at 0.4% of the total in low-income countries and 5.5% in high-income countries, and states plainly that exposure does not imply automation.
The OpenAI 80% Figure Counts Tasks
27. Around 80% of the US workforce could have at least 10% of their work tasks affected by large language models. Eloundou, Manning, Mishkin and Rock, GPTs are GPTs, March 2023.
28. Approximately 19% of workers may see at least 50% of their tasks impacted. The paper makes no prediction about adoption timelines and states that technical feasibility does not guarantee automation outcomes. This measure underlies the Stanford, Yale, Harvard and EIG results, so those papers are not independent of one another.
The OECD’s 27% Is Not An AI Figure
29. Occupations at the highest risk of automation account for 27% of employment across the OECD countries in the sample. From OECD Employment Outlook 2023, Chapter 3, 11 July 2023.
30. The same chapter’s footnote records 28% over a wider country set. Three details travel badly with this number: it covers AI and robotics together rather than AI alone, it is computed on 2019 employment data, and it is the top quartile of occupations ranked by automation risk rather than a probability that those jobs disappear. It is the only figure in this section that is not an AI-specific measure.
Goldman Sachs: 300 Million Jobs And 18% Of Work
31. Generative AI could expose the equivalent of 300 million full-time jobs to automation globally. From Goldman Sachs, analyzing the task content of over 900 occupations.
32. 18% of work globally could be automated by AI on an employment-weighted basis. That figure sits in the underlying Global Investment Research report by Briggs and Kodnani, 26 March 2023, rather than on the article page.
33. Roughly two-thirds of US occupations are exposed to some degree of AI automation. Goldman’s own wording is that these jobs could be automated to some degree, not that they will go. Most citations stop there. The sentence continues: of those exposed occupations, most have a partial share of their workload, 25% to 50%, that can be replaced. A partial share of a workload is not a job.
What The Bureau Of Labor Statistics Says Exposure Is Not
34. BLS classified 831 detailed occupations into four AI exposure categories using five external data sources. Three of the five are theoretical measures and two estimate exposure from observed AI usage. Published 27 August 2026 alongside the 2025-2035 projections.
The disclaimer BLS attached to it is worth quoting in full:
An exposure category is not a forecast of employment growth or decline. … An exposure category is not an estimate of the probability of AI adoption. An exposure category is not a worker replacement estimate. An exposure category is not a productivity forecast. An exposure category is not a wage forecast.
35. BLS publishes no employment data cut by exposure category. Anyone presenting one has built it themselves.
AI Job Loss Projections For 2030 And 2035
The projections below come from the US Bureau of Labor Statistics, the World Economic Forum’s employer survey, a McKinsey report and one economist’s macro model. Each describes how many jobs AI may affect in a modelled future, not what has happened. Forecasts of how many jobs AI will replace belong in this section and nowhere else.
BLS Projects The Slowest Decade Of Growth In Recent Record
36. US employment is projected to rise from 170.3 million to 176.2 million over 2025 to 2035, growth of 3.5%. That compares with 10.9% over the 2015-25 decade. From the BLS Employment Projections released 27 August 2026, which supersede the 2024-2034 numbers most coverage still quotes.
37. The economy is projected to add 5.9 million jobs over the decade.
38. Office and administrative support is projected to decline 4.0% and shed 752,100 jobs, the most of any major occupational group. BLS names the mechanism: the continued integration of automation tools, including those powered by AI, is likely to reduce demand for several office and administrative support occupations. The same release credits AI with driving growth in computing infrastructure, data processing and professional services.
The Benchmark Revision Everyone Still Quotes Was Cut
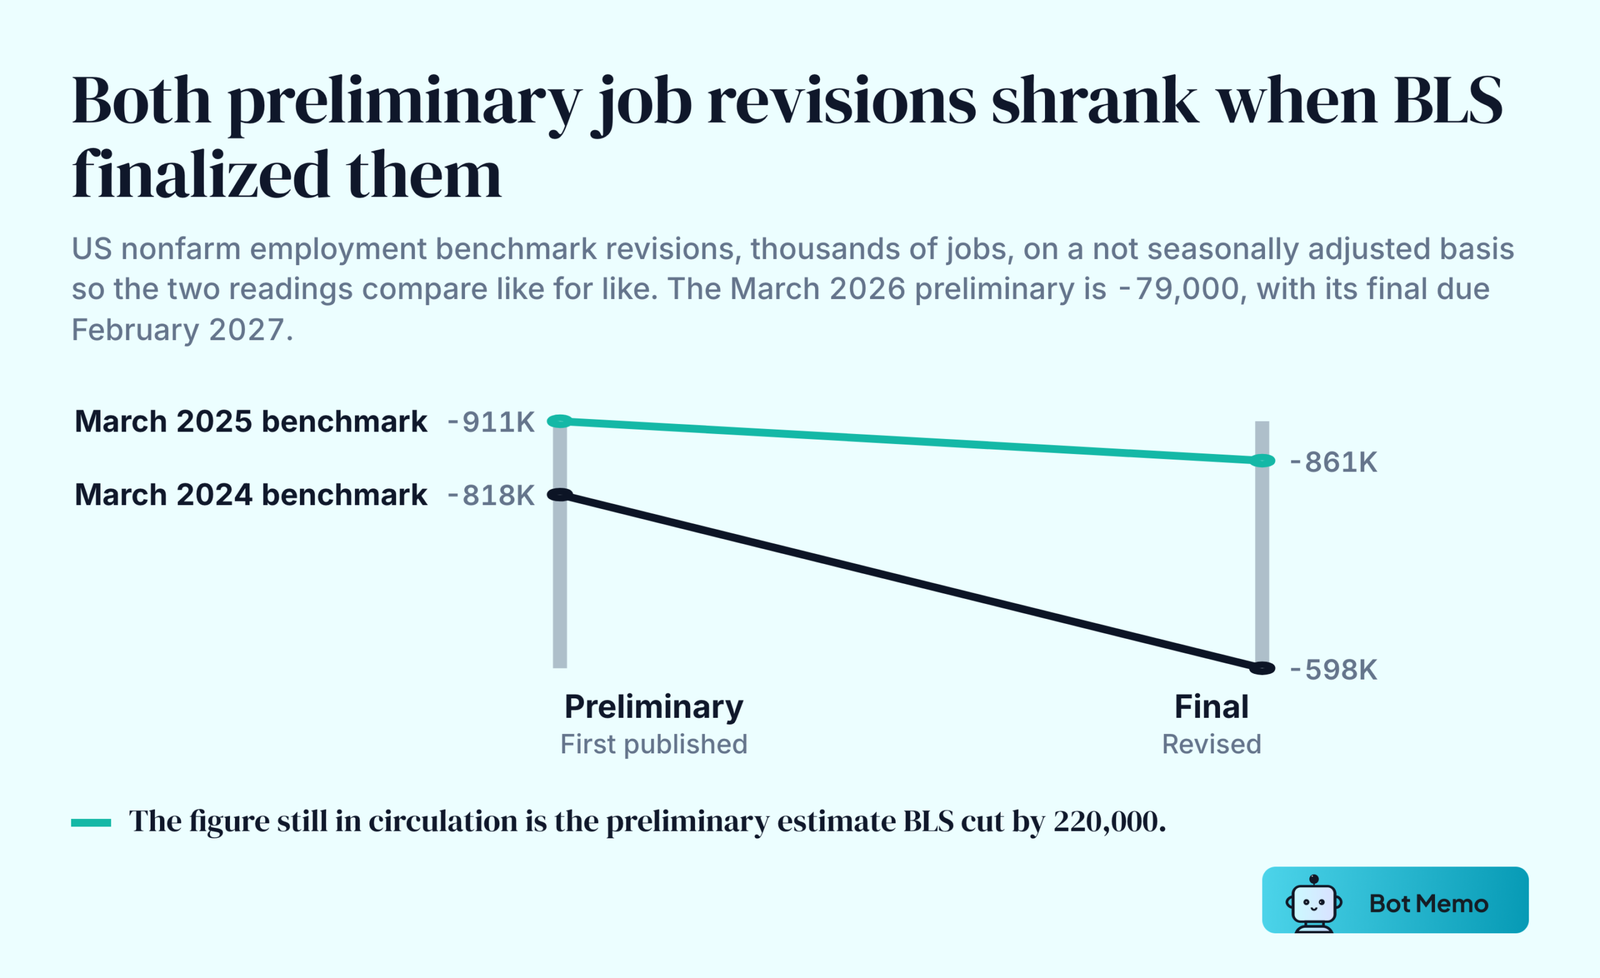
39. The March 2024 preliminary benchmark revision was -818,000, or -0.5%, on a not seasonally adjusted basis. That August 2024 notice is still live, which is why the number keeps circulating.
40. The final March 2024 revision was -589,000, or -0.4%, seasonally adjusted, and -598,000 not seasonally adjusted. Published 7 February 2025. Like for like against the preliminary, the revision shrank by 220,000.
41. The March 2025 preliminary was -911,000; the final was -898,000 seasonally adjusted and -861,000 not seasonally adjusted after BLS adjusted for an industry reclassification. The unadjusted headline reading is -862,000. Like for like against the preliminary, the cut is 50,000, published 11 February 2026.
42. The March 2026 preliminary is -79,000 for total nonfarm employment and -178,000 for total private. Released 28 August 2026, an order of magnitude smaller than either of the two before it. The final is due in February 2027.
Employer Surveys Point Both Ways, And The WEF Flipped Its Own Sign
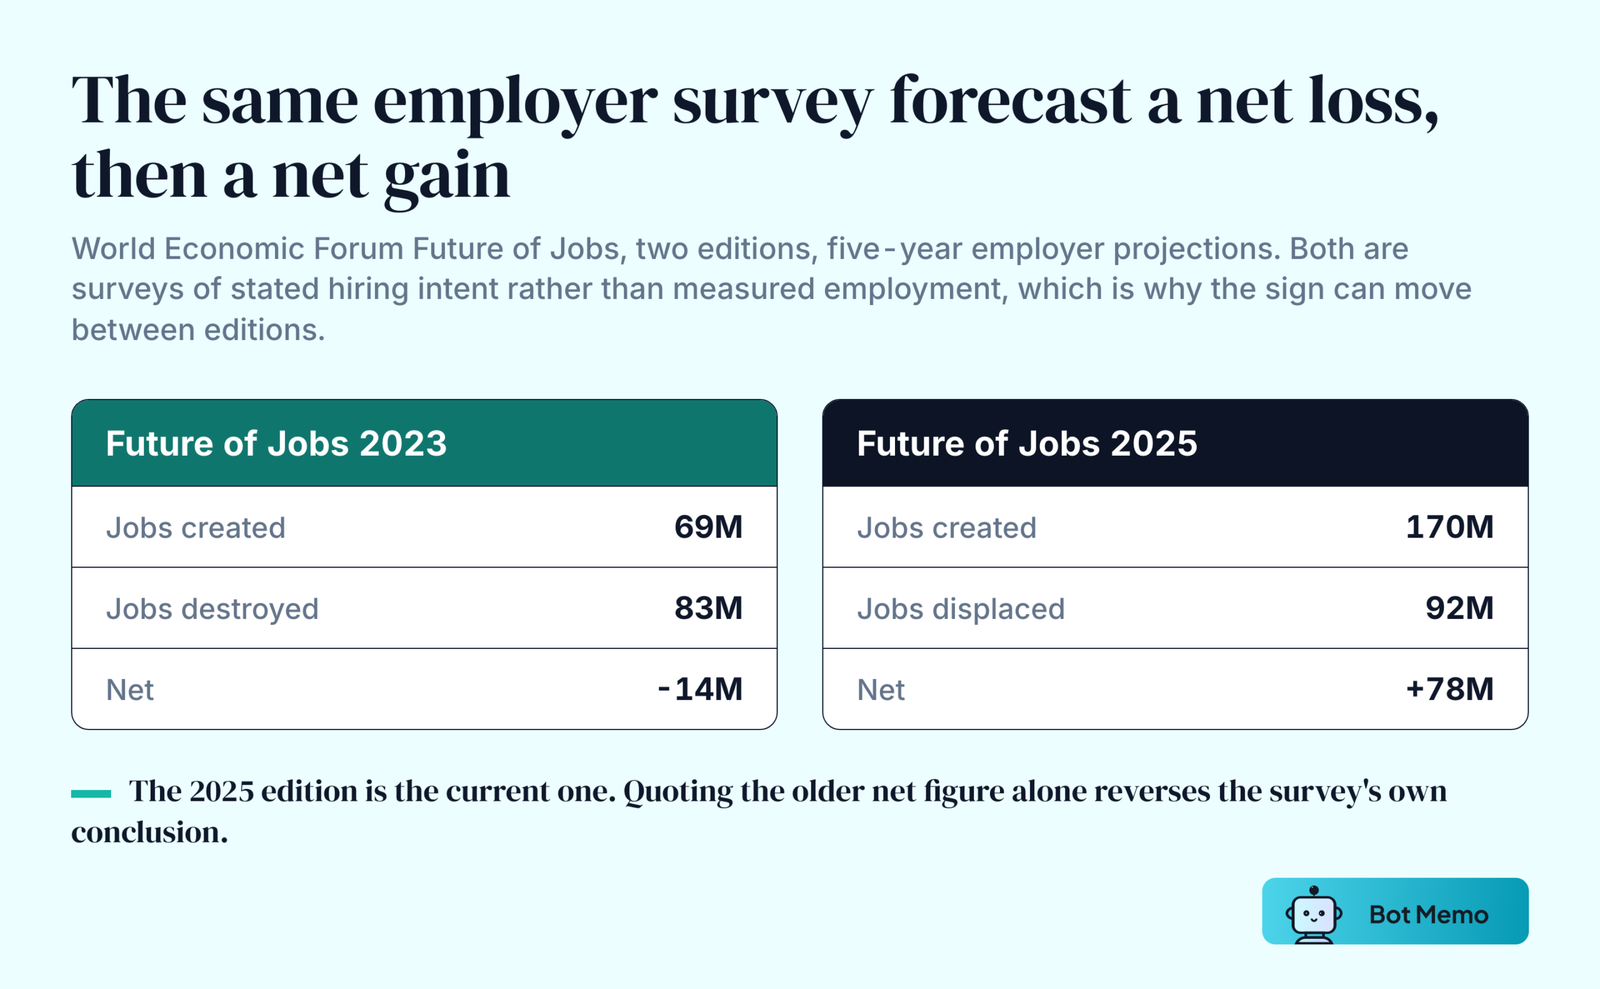
43. The World Economic Forum projects 170 million jobs created and 92 million displaced over five years, a net increase of 78 million. From the Future of Jobs Report 2025, January 2025, which remains the current edition.
44. That churn amounts to 22% of the 1.2 billion formal jobs in the dataset. The base is over 1,000 employers representing more than 14 million workers across 55 economies. This is an employer opinion survey, so it measures stated intent.
45. 41% of employers expect to downsize their workforce as AI capabilities to replicate roles expand. A separate 41% appears elsewhere in the report for reductions due to skills obsolescence; the two are different findings.
46. The 2023 edition projected 69 million jobs created and 83 million destroyed, a net contraction of 14 million. The WEF moved from a projected net loss to a projected net gain between editions, which is why the 2023 net figure should never be quoted on its own.
47. The 2023 edition put record-keeping and administrative roles at 26 million fewer jobs by 2027. Data entry clerks, secretaries and payroll clerks were expected to suffer the greatest reduction, together making up over half of that edition’s expected job destruction.
48. Employers in that edition expected 25% to 35% less demand for cashiers and ticket clerks, data-entry clerks, accounting, bookkeeping and payroll clerks, and secretaries.
The Macro Bound Is Smaller Than Any Consultancy Forecast
49. Daron Acemoglu estimates no more than a 0.71% increase in total factor productivity over ten years. Roughly 0.07% a year, from The Simple Macroeconomics of AI, April 2024. He calls it an upper bound, and it is a model calibration rather than a measurement.
50. The same paper puts GDP growth at around 1.1% over ten years, rising to 1.6% to 1.8% under an alternative investment assumption. He stresses that the welfare-relevant number is productivity, because the extra investment comes out of consumption.
Four McKinsey Projections, Carried With A Warning
McKinsey’s 2023 work on generative AI and the future of work in America is the source of four figures that circulate widely, including on the previous version of this page. They are carried here with their original figure, source and date, and they remain a 2023 projection rather than a measurement.
51. Activities accounting for up to 30% of hours currently worked across the US economy could be automated by 2030. A projection of automatable hours, not of jobs eliminated.
52. An additional 12 million occupational transitions may be needed by 2030, around 25% higher than a projection made two years earlier. Read the “higher than two years ago” comparison against the earlier projection it revises rather than on its own, because the baseline moved between the two.
53. The US labor market saw 8.6 million occupational shifts during 2019 to 2022. A count of workers changing occupational category, which includes moves that have nothing to do with AI.
54. Demand for STEM jobs is projected to rise 23% by 2030. The same report’s growth side, and the one least often quoted beside the displacement figures.
Which Jobs Are Most Likely To Be Replaced By AI
Clerical and administrative work sits at the top of every ranking of jobs at risk that exists. White-collar jobs built on document handling dominate the exposed end; physical and interpersonal work sits at the bottom.
Pew Puts Mechanical Drafters Among The Most Exposed
55. 32% of workers in information and technology say AI will help them more than it hurts, against 11% who say it will hurt more. From Pew Research Center’s July 2023 analysis, an American Trends Panel survey of 11,004 US adults fielded in December 2022.
56. Mechanical drafters are among the workers most exposed to AI, and nannies are among the least. Pew uses the two as a contrasting pair. Earlier versions of this page placed both in the least-exposed group, which inverted the source.
57. For nannies, high-exposure activities have an average rating of 2.36 against 3.03 for low-exposure activities. The exposure ranking is a separate dataset from the survey, built on O*NET across 873 detailed occupations.
What The Robot Research Actually Measured
58. One more robot per thousand workers reduces the US employment-to-population ratio by 0.2 percentage points and wages by 0.42%. Acemoglu and Restrepo, Robots and Jobs, Journal of Political Economy volume 128 number 6, 2020.
59. Each additional robot added in manufacturing replaced about 3.3 workers nationally. That is the derived national count, net of general-equilibrium offsets (MIT, May 2020).
60. In commuting zones where robots were added, each robot replaced about 6.6 jobs locally. The national and local figures get conflated constantly, and both describe industrial robots between 1990 and 2007, not AI.
Which Jobs AI Cannot Replace
61. 40% of US workers carry zero measured AI exposure, the New York Fed figure above. Physical, interpersonal and supervisory work dominates that group, and the ILO found that AI exposure outside clerical support runs between 1% and 4%. No exposure measure above ranks caregiving, skilled trades or hands-on service work as highly exposed to AI.
AI Adoption By Businesses, And The Job Losses They Report
Firm-level surveys are the closest thing to a direct count of jobs lost due to AI, because they ask employers whether deploying AI changed headcount. Generative AI adoption has risen fast. The reported effects of AI on employment have not followed.
The Census Bureau Changed Its Question And Broke The Series
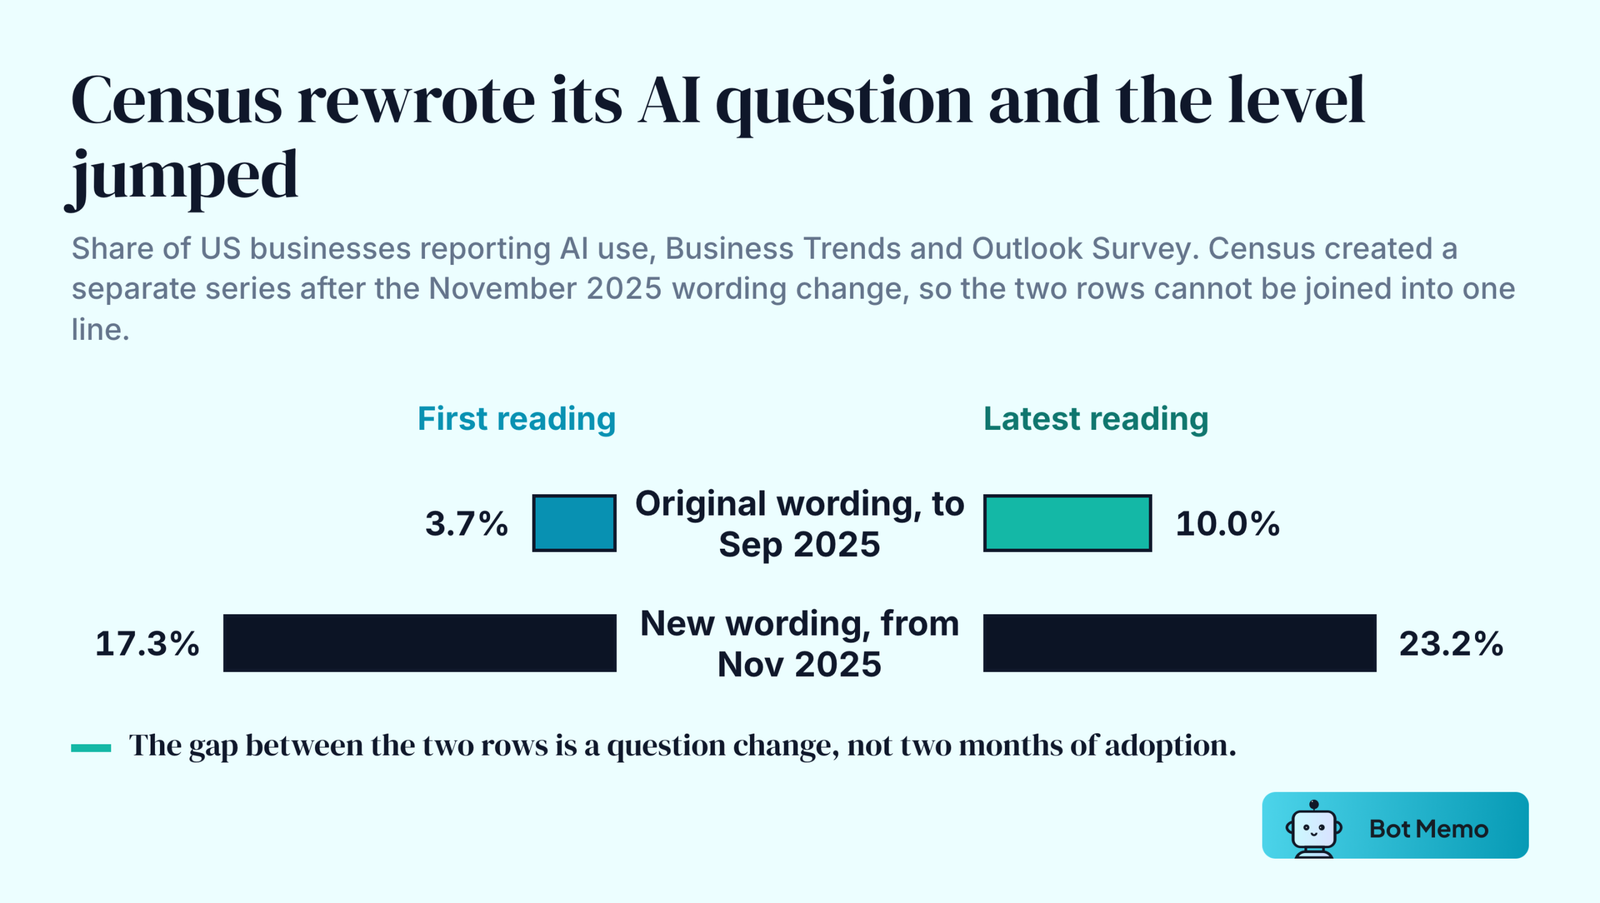
62. Under its original wording, Census AI use among US businesses rose from 3.7% to 10.0%. The question asked whether a business used AI in producing goods or services in the last two weeks. The readings cover early September 2023 and mid-September 2025.
63. Under the new wording, the figure runs from 17.3% to 23.2%. The revised question asks about AI use in any business function. The readings cover late November 2025 and late August 2026.
64. Census created a separate time series because of the level shift the new wording produced. Running 3.7% straight through to 23.2% crosses that break. The honest pairings are old wording to old wording, or new to new.
65. Businesses expecting to use AI within six months rose from 21.1% to 27.3% across the same two new-wording periods. The survey samples about 1.2 million nonfarm employer businesses across six rotating panels of roughly 200,000 each.
Only A Small Share Of AI-Using Firms Report Any Headcount Change
66. About 5% of AI-using firms report any headcount impact at all. From the Census Center for Economic Studies working paper The Microstructure of AI Diffusion, April 2026, pooled over more than 117,000 firms. It is staff research carrying an author-views disclaimer, not an official statistic.
67. Increases run 2.3% firm-weighted and 3.7% employment-weighted; decreases run 2.0% firm-weighted and 2.4% employment-weighted. The 2.0% is a share of AI-using firms, not of all firms, and that distinction is the one most often lost.
68. The same paper reports 18% of all firms using AI in a business function, 32% employment-weighted, with 22% expected within six months.
The UK And Canada Report The Same Pattern
69. Among UK businesses using AI to improve operations, 63% reported no change in worker headcount, 1% an increase and 6% a decrease. From the Office for National Statistics, Artificial intelligence in UK businesses: 2023 to 2026, 20 July 2026. The ONS describes the employment impact as limited at this stage.
70. Self-reported AI use among UK businesses with 10 or more employees rose from around 12% to around 35% since late 2023, with just under 7% of medium-sized businesses reporting a headcount decrease.
71. In Canada, 19.2% of businesses reported using AI in the second quarter of 2026, tripled from 6.1% two years earlier. Statistics Canada, 11 June 2026, from 9,251 responding businesses.
72. Over two in five Canadian AI users, 44.4%, changed training or staffing practices because of AI use. Within that group, 32.0% provided AI training for existing employees and 21.6% for existing executives. The 19.2% is of all businesses; the 44.4% is only of AI users.
Why UK Firms Said They Adopted AI
73. 35% of UK businesses named financial or cost savings as their main reason for using AI technologies. From the UK Government’s AI cyber security survey, which carries an adoption section. UK-only.
74. 14% used AI to help write documents, 13% cited speed and efficiency purposes, and 12% used it for content generation more broadly.
75. Each AI technology was most commonly adopted by buying external software or ready-to-use systems, ranging from 38% to 60%. Around one in five businesses developed machine learning (21%) and AI-related hardware (19%) in-house.
How Workers Feel About AI Replacing Their Jobs
A Quarter Of US Workers Worried Their Job Would Become Obsolete
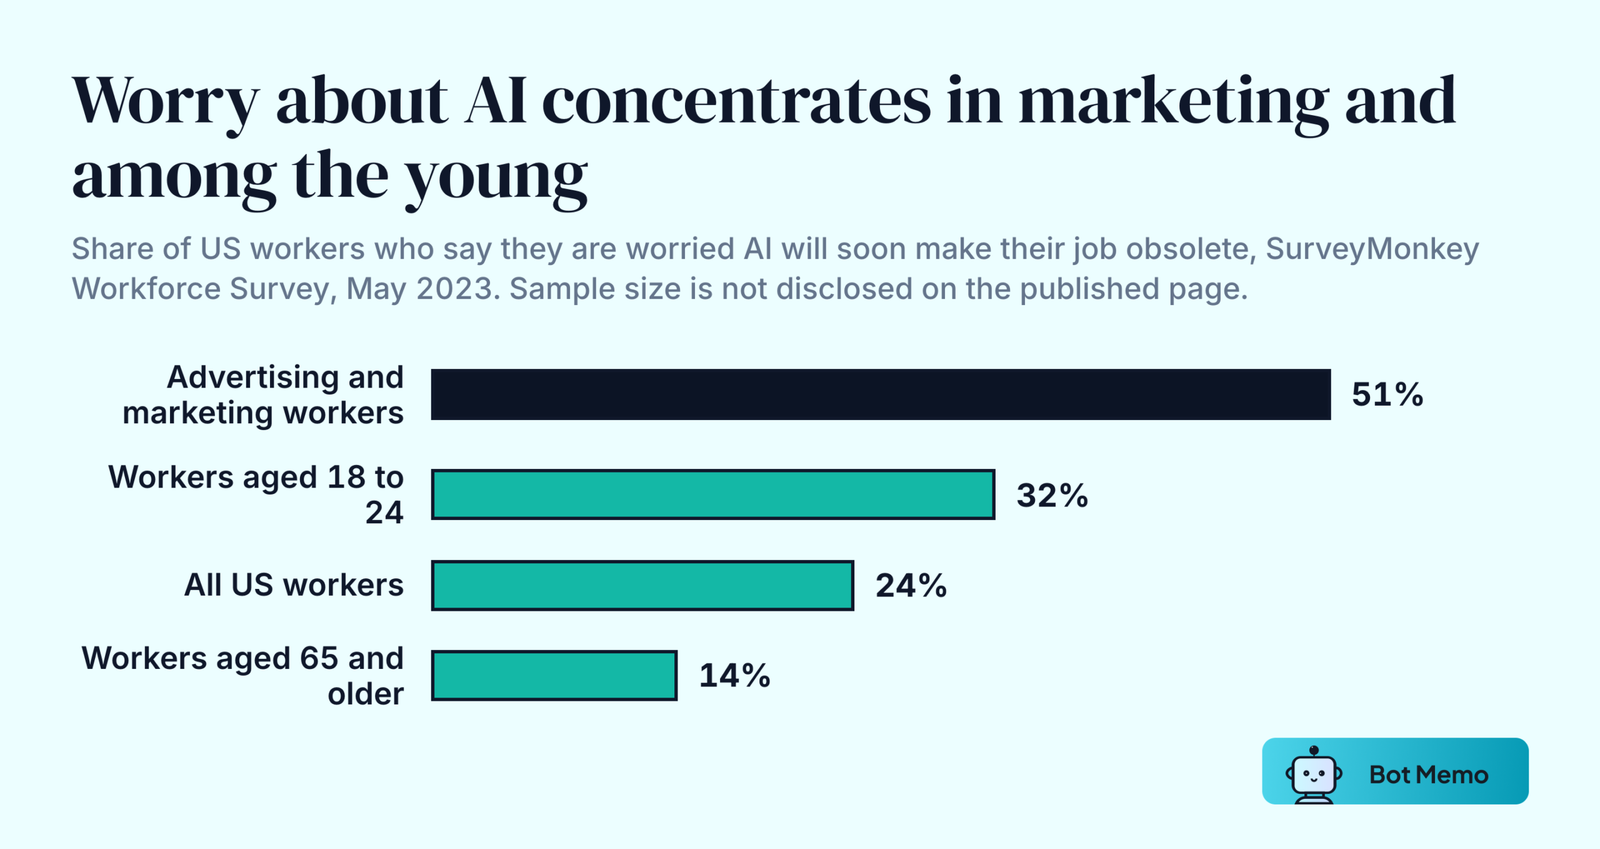
76. 24% of workers are worried AI will soon make their job obsolete, and 74% say they are not. From the SurveyMonkey Workforce Survey, May 2023. Neither the sample size nor the exact field window is disclosed on the published page.
77. Concern falls with age: 32% of workers aged 18 to 24 are worried, against 14% of workers 65 and older.
78. 51% of advertising and marketing workers said they were worried, more than double the overall rate.
79. 56% of workers are not comfortable with AI being used to assist HR with hiring, performance evaluations and operations.
Those four readings are from 2023. The same survey series put a different question in May 2026 and found 19% of US workers saying AI makes their job feel less secure, 55% saying AI will eventually do at least some parts of their job as well as they do, and 28% expecting it to take over at least a quarter of their responsibilities. Worry has risen, and it is still a sentiment measure rather than a count of jobs.
Developers Predicted A Speed-Up And Measured A Slowdown
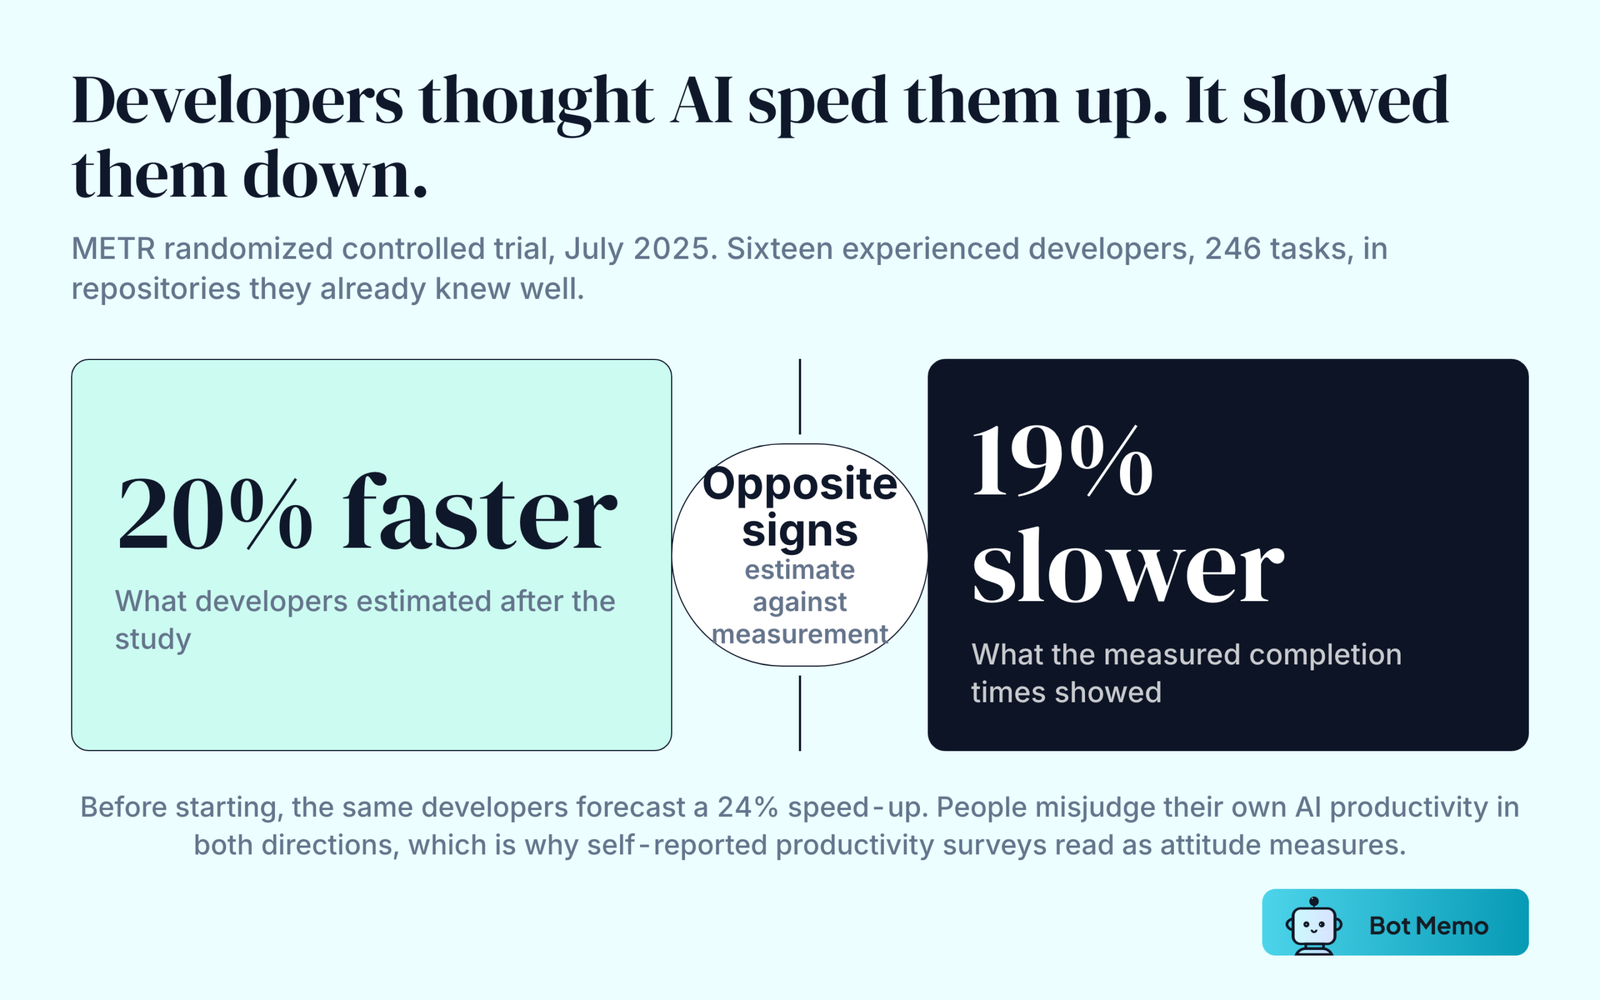
80. Experienced developers forecast that AI would cut their task completion time by 24%. From METR’s randomized controlled trial, July 2025, covering 16 developers and 246 tasks in repositories where they averaged five years of experience.
81. After finishing the tasks, the same developers estimated AI had cut completion time by 20%.
82. Measured against the clock, allowing AI increased completion time by 19%. The authors say this does not imply that AI tools are unhelpful in realistic settings. It does show that people misjudge their own productivity in both directions, which is reason enough to read every self-reported AI productivity survey as an attitude measure.
What AI Researchers Themselves Forecast
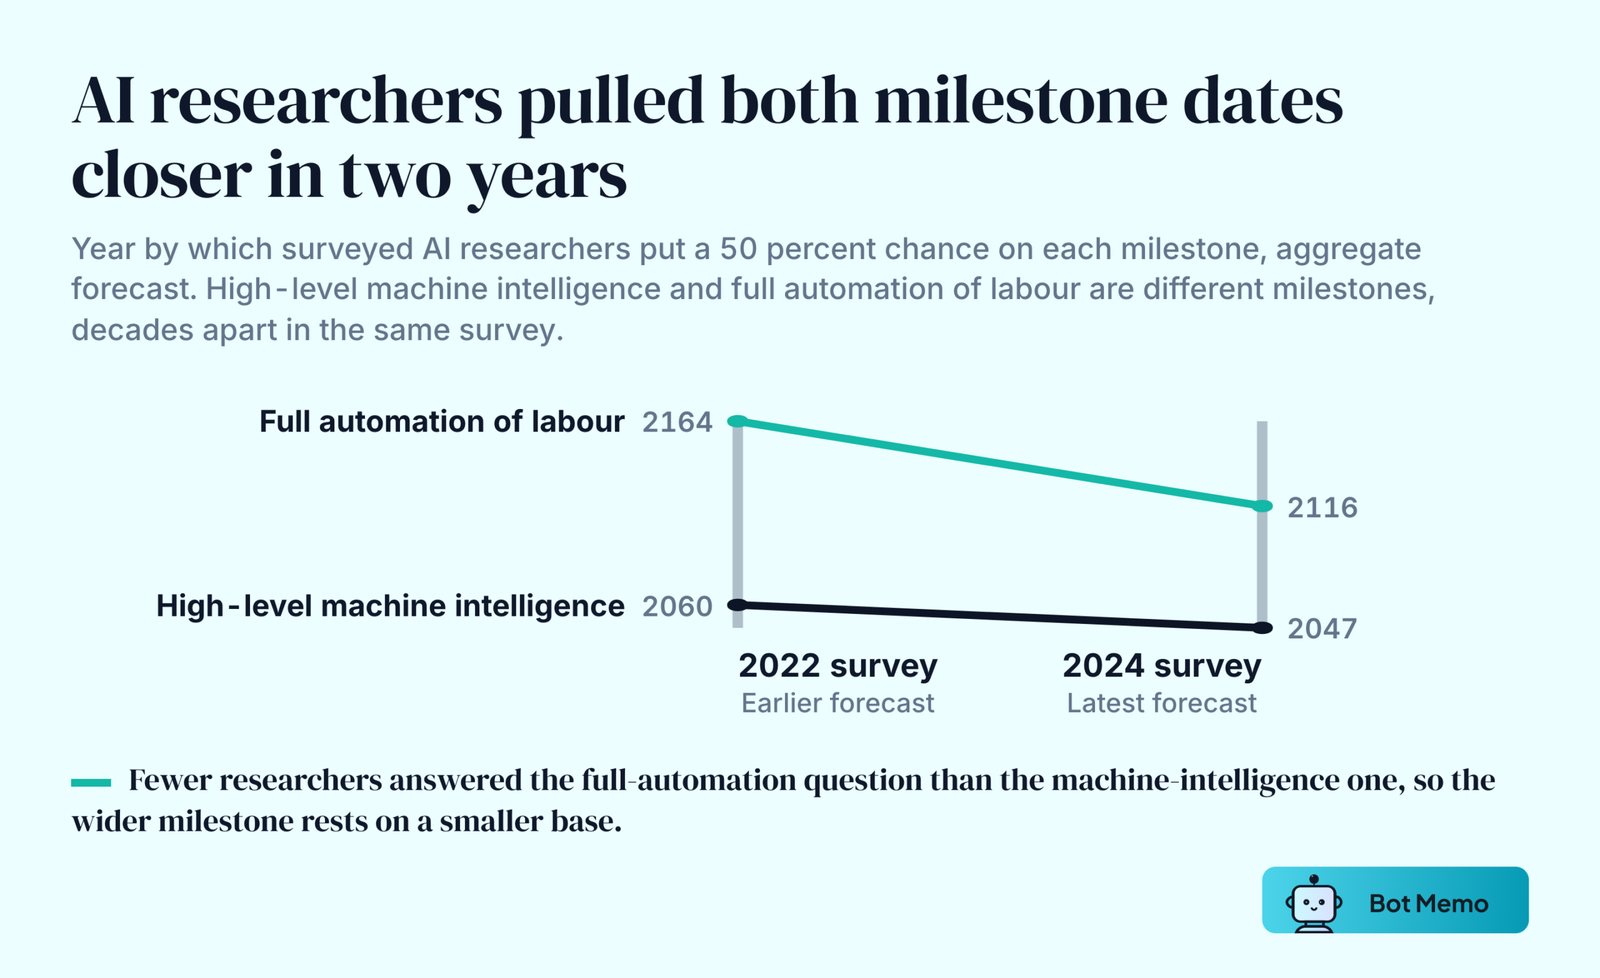
83. 2,778 researchers who had published in top-tier AI venues were surveyed, a 15% response rate from 18,459 functioning email addresses. Thousands of AI Authors on the Future of AI, January 2024. The base is far smaller for individual questions.
84. 68.3% thought good outcomes from superhuman AI are more likely than bad.
85. The chance of all human occupations becoming fully automatable was forecast to reach 10% by 2037 and 50% as late as 2116, against 2164 in the 2022 survey. That milestone is Full Automation of Labor, and 774 researchers answered it.
86. The aggregate forecast put a 50% chance of high-level machine intelligence at 2047, down thirteen years from 2060 in the 2022 survey. 1,714 researchers answered it. High-level machine intelligence and full automation of labour are different milestones, decades apart in the same paper.
What Model Usage Data Shows
87. Automation’s share of Anthropic’s first-party API traffic fell from 77% in August 2025 to 75% in November 2025 and 68% in February 2026, with augmentation rising from 12% to 14% to 17% across the same three editions of the Anthropic Economic Index. The widely quoted 77% is the oldest of the three readings and points the wrong way.
88. Anthropic walked back its own crossover claim. Its January 2026 edition reports that directive conversations fell 7 points to 32% by November 2025 as augmentation again became more prevalent on Claude.ai, and says the August spike overstated how quickly automation was materializing. Rerunning with an older classifier moved automation from 49% to 45%, so part of that spike was a model change.
89. On OpenAI’s GDPval benchmark, 47.6% of deliverables produced by Claude Opus 4.1 were graded as better than or as good as the human deliverable. From GDPval, October 2025, across a 220-task gold subset drawn from 1,320 tasks in 44 occupations, graded blind against work by professionals averaging 14 years of experience. The tasks are one-shot, not interactive.
The New Jobs AI Creates
Most Of Today’s Work Did Not Exist In 1940
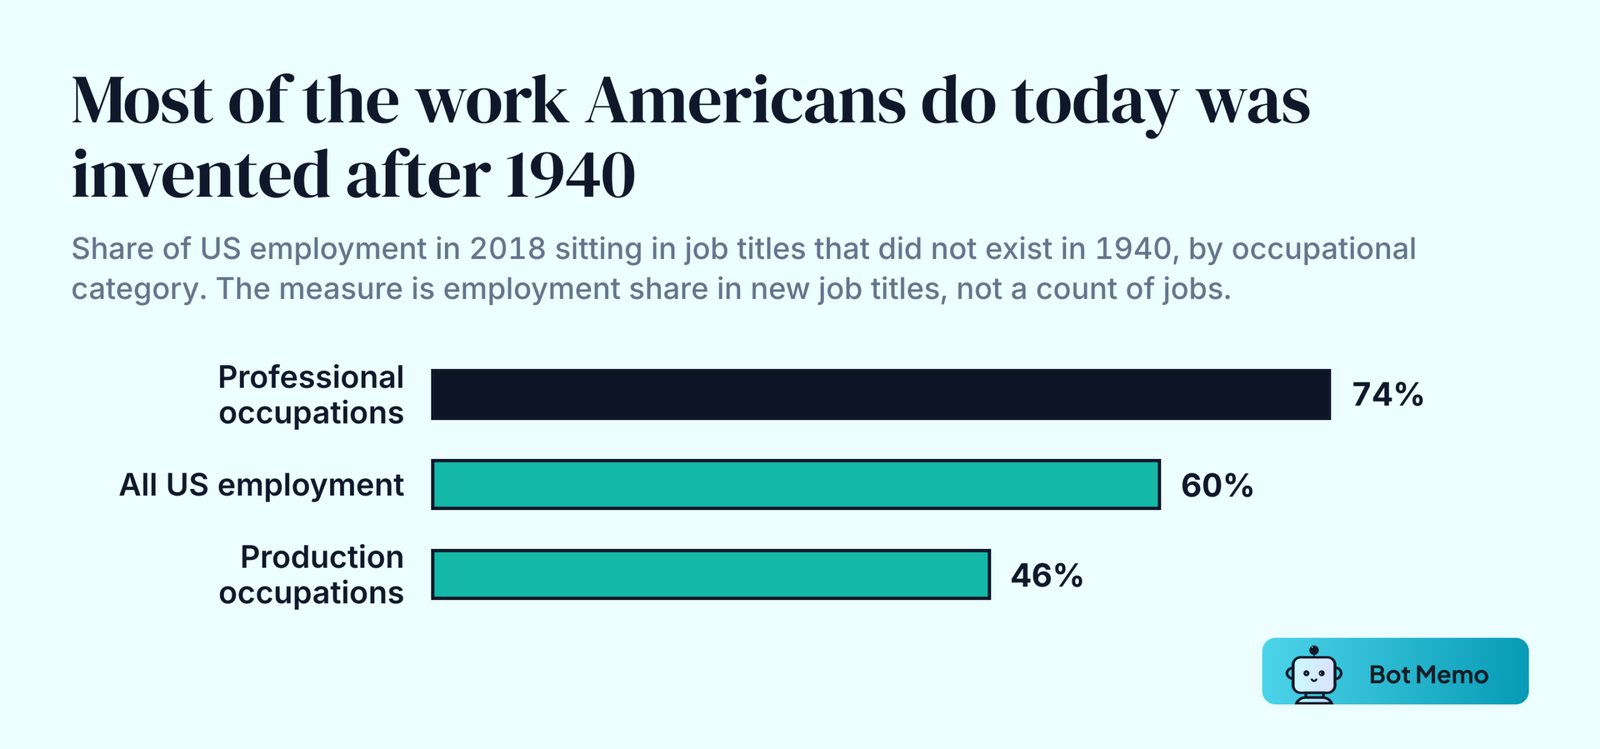
90. Roughly 60% of US employment in 2018 was in job titles that did not exist in 1940. Autor, Chin, Salomons and Seegmiller, New Frontiers, NBER Working Paper 30389, August 2022. The measure is employment share in new job titles, not a count of jobs.
91. Among professionals the share is 74%; in production occupations it is 46%.
The New-Work Wage Premium Is Real, Small And Fading
92. The raw wage premium on new work is 15.6 log points in 2011-2023, against 9.0 log points in 1950. From the same authors’ What Makes New Work Different from More Work?, March 2026.
93. Conditional on controls, the premium falls to 1.8 log points in contemporary data and 1.4 historically. Most of the raw gap is composition, because new work sits in higher-wage occupational categories to begin with.
94. Technology-linked new work carries 3.8 log points of that premium, against 1.0 for other new work.
95. The premium decays as the expertise spreads: 4.72 log points for titles introduced between 2000 and 2018, 1.57 for 1980 to 2000, and -0.82 for titles introduced between 1970 and 1980. If AI creates new work, its wage premium should be expected to erode the same way.
96. New work has historically been performed disproportionately by younger and more educated workers, the same cohort the Stanford and Harvard papers find losing ground.
The Argument About Automation And AI Is Older Than It Looks
Robert Solow, the MIT economist awarded the 1987 Sveriges Riksbank Prize in Economic Sciences in Memory of Alfred Nobel, made the case in Problems That Don’t Worry Me in 1962, sixty-four years ago:
But suppose that the prophets of a second industrial revolution are right… Is there danger of mass technological unemployment? I don’t think so, though neither would I accept the Pollyanna position that all such transitions are accomplished smoothly and automatically. … These are problems of adjustment, not of catastrophe.
Solow died in December 2023.
Key Takeaways
- No study using national registers, CPS data or job postings has found evidence that AI is replacing jobs across the economy. The Yale Budget Lab, the Federal Reserve Board, the New York Fed and Danish administrative records all report nulls.
- The one consistent exception is young workers. Stanford’s 19% gap and Harvard’s junior-versus-senior split both find it, both in private data, and Danish registers bound the same effect at well under a percentage point.
- Exposure figures and displacement figures answer different questions. The IMF’s 40%, the OECD’s 27% and OpenAI’s 80% measure task overlap; BLS published a five-line disclaimer saying its own exposure categories forecast nothing.
- Firms that use AI mostly report no headcount change. About 2% of AI-using US firms report decreases, and 6% of UK businesses using AI to improve operations do.
- The biggest numbers in circulation are projections. The WEF reversed its own net sign between editions, and the -818,000 BLS revision that keeps getting quoted was cut to -598,000 on a like-for-like basis.
Frequently Asked Questions
How Many Jobs Has AI Replaced So Far?
No official statistic counts jobs replaced by AI, and the research that looks for one mostly finds nothing at scale. The closest measured figures are firm self-reports: about 2.0% of AI-using US firms told the Census Bureau they had decreased headcount because of AI, and 6% of UK businesses using AI to improve operations told the ONS the same.
What Percentage Of Jobs Will AI Replace?
Nobody has measured it, and the widely quoted percentages showing how many jobs could be automated measure exposure instead. The IMF puts global exposure near 40% and advanced-economy exposure near 60%. The OECD’s 27% covers all automation technologies on 2019 data. Goldman Sachs estimates 18% of work globally could be automated, which is work, not jobs.
Which Jobs Are Most At Risk From AI?
Clerical and administrative work, on every measure above. The ILO finds clerical support the only broad occupation group with high exposure. BLS projects office and administrative support to shed 752,100 jobs by 2035, more than any other major group. Pew names mechanical drafters among the most exposed occupations.
Are Young Workers Losing Their Jobs To AI?
In some datasets. Stanford finds 22 to 25 year olds in AI-exposed occupations 19% below their less-exposed peers, and Harvard finds junior employment at AI-adopting firms falling relative to controls while senior employment rises. Danish administrative registers, the New York Fed’s posting panel and the OECD find no such effect, and the OECD notes the graduate gap was widening before firms adopted large language models.
Is AI Creating More Jobs Than It Replaces?
The WEF’s employer survey projects 170 million jobs created against 92 million displaced through 2030, a net gain of 78 million. Historically the creation argument holds: roughly 60% of US employment in 2018 sat in job titles that did not exist in 1940. The wage premium on that new work, once controls are applied, is 1.8 log points and shrinks as the skills spread.
Do Workers Think AI Will Replace Their Jobs?
In May 2023, 24% of US workers said they were worried AI would soon make their job obsolete, against 74% who were not. Worry ran highest among 18 to 24 year olds at 32% and among advertising and marketing workers at 51%.
By May 2026 the same survey series found 19% saying AI makes their job feel less secure and 55% saying AI will eventually do at least some parts of their job as well as they do. Both are measures of sentiment about the impact of AI on jobs, not of jobs affected.
Sources And Methodology
Every figure here was read at the document that published it. Figures are US-only unless a geography is named. Three distinctions are held throughout: exposure measures task overlap rather than displacement, a relative decline between two groups is not a headcount loss, and a forecast is not a measurement.
That is why the Stanford 19% appears beside both the 11% absolute fall inside its sample and the paper’s own finding of no economy-wide displacement, and why the projections sit in their own section.
Retired from the previous version of this page, each with a reason.
- “Around 8 million data entry jobs lost by 2027,” credited to the WEF Future of Jobs Report 2023. No such figure exists in that report; the only source for it is an unlabelled bar in Figure 3.5. The report’s own stated number, 26 million fewer record-keeping and administrative jobs, replaces it as stat 47.
- A Statista table of generative AI adoption by industry. Statista is an aggregator, four of the six percentages are paywalled, and the underlying Fishbowl poll surveys self-selected users of a workplace app. Census Bureau and Statistics Canada figures answer the same question from probability samples.
- “Only 400 people were working in AI safety in 2022” and a 3% to 50% risk range, credited to 80,000 Hours. Neither figure is on that page, which now cites a 2025 analysis counting 1,100 people. The surrounding existential-risk section, including a claim about 40,000 potential chemical warfare agents, is cut as off-topic for an article about employment.
- “AlphaZero surpassed all accumulated human knowledge about Go after a day or so of self-play.” Uncited and wrong. DeepMind reports 30 hours for AlphaZero and three days for AlphaGo Zero. A 2017 board-game result does no work here, so the opener is gone.
Corrected rather than dropped.
- Pew names mechanical drafters among the most exposed workers. Only nannies are least exposed. The previous version collapsed Pew’s contrasting pair into one bucket.
- “33% of automation is used to substitute workers” is a category error. It is 33% of firms that automated, citing substitution as one multi-select reason alongside product quality (58%), output (49%) and labor costs (47%), from the Q2 2024 CFO Survey run by Duke with the Atlanta and Richmond Feds.
- The 61% and 32% CFO Survey figures appear on neither of the survey’s own pages, which report that among the 60% of firms expecting to automate, 54% (76% of large firms) plan to use AI for tasks previously done by employees. The 61% and 32% come from press coverage of that survey, not from published survey output.
- Robert Solow received the 1987 Sveriges Riksbank Prize in Economic Sciences in Memory of Alfred Nobel. There is no Nobel Prize in economics.
- The 818,000 revision was preliminary and was superseded. Every published reading now appears with its basis, because BLS computes the preliminary not seasonally adjusted and leads the final with a seasonally adjusted figure.
- The 60%-of-jobs claim now cites the NBER working paper rather than a figure-reproduction page, and states what it measures: employment share in job titles absent in 1940, as of 2018.
- The robot figure appeared twice, the second time rounded to “3 human jobs.” The duplicate is gone and the national (3.3) and local (6.6) figures are labelled.
Carried with their status stated. The McKinsey figures, stats 51 to 54, are a 2023 projection and appear with their original figure, source and date rather than as a current reading. The Harvard seniority paper circulates in several working-paper versions whose reported magnitude differs, so stat 11 states the finding by direction and stat 12 pins the 9% to the October 2025 version rather than presenting it as settled.
Related reading: AI statistics for 2026, AI writing statistics, AI design statistics, AI in education statistics and how many AI companies exist.

About the author
Editorial Staff
The Editorial Staff at Bot Memo is a team of writers, analysts, and AI agents dedicated to mapping the global AI startup ecosystem. Led by Chintan Zalani, the team tracks thousands of funding rounds, classifies companies across verticals, and distills it all into actionable intelligence for investors and founders.