


Weekly AI use among designers is close to universal in the one survey that measures it. The AI in Design Report 2026, fielded in the first quarter of the year, puts it at 91% of its respondents, up from 54% a year earlier. Trust is a different question, asked of a different group. In UX Tools’ Spring 2026 survey of 1,478 designers, 9.5% let AI output reach a shipped design with light review or none. Different samples, different questions. Most of this page is about why those two numbers are not the same measurement.
On this page
- Key AI Design Statistics for 2026
- How Many Designers Use AI in 2026
- Which Tools Designers Use Weekly
- How Far Designers Trust AI Output
- Who Is Using AI Heavily
- AI and Design Jobs
- What the Design Platforms Report
- AI Design Market Size Forecasts
- Funding for AI Design Startups in 2026
- Frequently Asked Questions
- Notes on the Figures
Key AI Design Statistics for 2026
- 91% of respondents use AI at least weekly and 75% use it daily, against 54% weekly a year earlier (AI in Design Report 2026, more than 900 designers in 60-plus countries, fielded in the first quarter of 2026 and weighted toward product designers).
- Only 1.4% trust AI output without oversight, and 8.1% say it ships with minor tweaks. Most designers stop it at a first draft they heavily edit (34.2%) or at exploration (29.2%) (UX Tools, n=1,478).
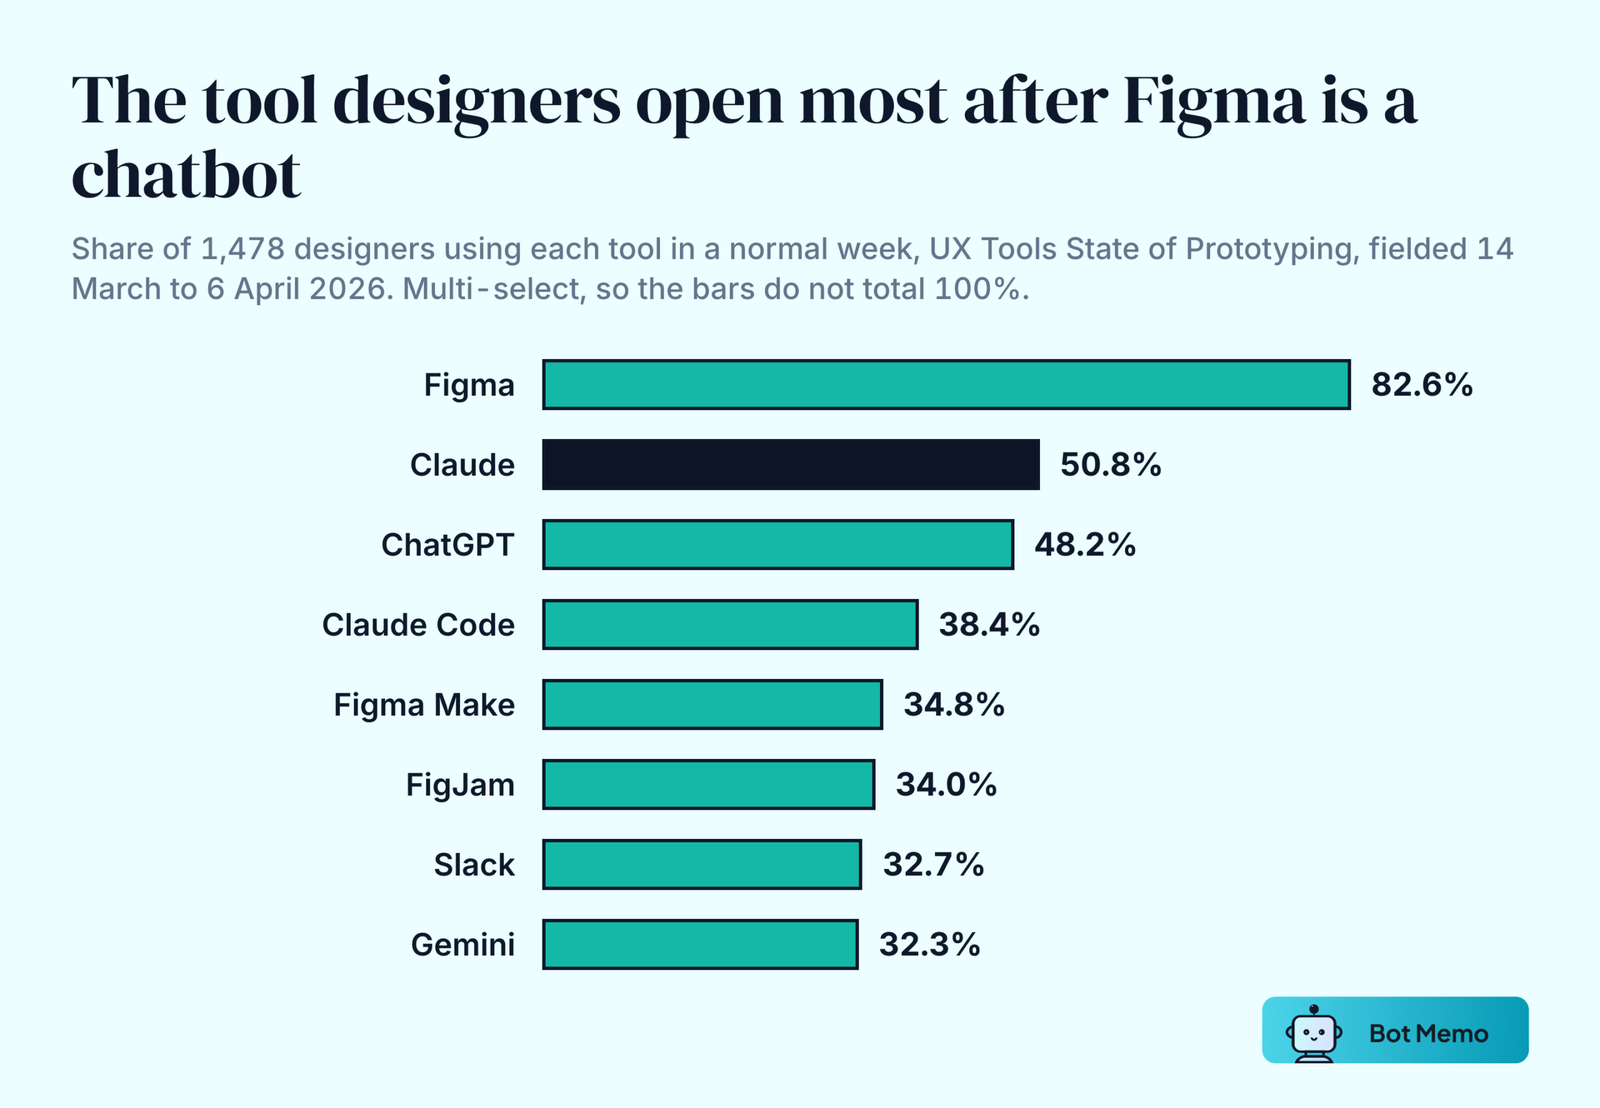
- The most-used weekly tool after Figma is a chatbot. Figma 82.6%, Claude 50.8%, ChatGPT 48.2%. Five of the ten most-used weekly tools are AI tools (UX Tools).
- 43.8% of respondents generate half or more of what they build with AI, while the largest single answer was none, at 37.7% (UX Tools).
- US graphic design employment is projected to fall 2% between 2025 and 2035, a loss of 4,200 jobs, and the Bureau of Labor Statistics names AI as a reason. Web and digital interface design is projected to grow 6% over the same decade (BLS).
- Adobe’s AI-first ARR passed $650 million in Q3 FY2026, up more than 150% year over year, against total annualized recurring revenue of $27.50 billion (the $650 million is from Adobe management on the earnings call; the growth rate and the $27.50 billion are in Adobe’s filed results).
- More than 80% of Figma’s paid customers above $10,000 in ARR use AI credits every week, and Figma’s Q2 2026 revenue grew 48% to $370.1 million (Figma).
- Canva reported 260 million monthly users and $3.5 billion of revenue for 2025, its whole business rather than an AI line, which it does not break out (Canva).
- Canva cut its 2026 revenue growth forecast from 30% to 20% because the average cost of serving an AI task was too high, then cut that cost by about 90% (Melanie Perkins’ Q2 2026 shareholder update, reported by Startup Daily).
How Many Designers Use AI in 2026
This page draws on four designer surveys published in 2026. They measure different things, so none of them corroborates another, and only one publishes a weekly adoption rate. The AI in Design Report 2026, run by Designer Fund with Foundation Capital and fielded in the first quarter of the year across more than 900 designers in over 60 countries, found 91% using AI weekly and 75% using it daily. The average respondent’s toolstack went from three tools to seven over the year.
Figma’s State of the Designer 2026, run with NewtonX across 906 digital designers in five regions, reports 91% saying AI tools improve the quality of their designs, a different question from weekly use, alongside 89% saying they work faster and 80% saying they collaborate better. Figma’s 2026 AI Report, built on 8,403 survey responses gathered over three years and 639 interviews, this year across ten markets after three were added, found 41% saying AI meaningfully changes how their teams work together, against 7% two years earlier.
Read the sample descriptions before you quote any of this. The AI in Design Report skews hard toward product designers at technology companies: 86% of its respondents work in product design and 42% sit at startups of 50 people or fewer. Its partner list includes Anthropic, Framer, Linear, Notion, Shopify, Sierra and Stripe, several of which make the tools the report measures. Two of the four reports are published by Figma, which sells the tools they ask about. UX Tools draws from a prototyping-focused audience and publishes its raw response data under an open license, which is why the rest of this page leans on it.
Which Tools Designers Use Weekly
UX Tools asked 1,478 designers which tools they use in a normal week between 14 March and 6 April 2026. Figma led at 82.6%. The next four places went to Claude (50.8%), ChatGPT (48.2%), Claude Code (38.4%) and Figma Make (34.8%). Gemini took eighth at 32.3%, and Google’s Nano Banana image model, which UX Tools lists as Nanobanana, reached 18.5% weekly use.
Claude Code and Figma Make are code-generation surfaces, and both outrank Slack at 32.7% in a designer’s week. Cursor, a code editor, reached 21.2%.
Top Ten Weekly Tools Among Designers
| Tool | Weekly use | Type |
|---|---|---|
| Figma | 82.6% | Design canvas |
| Claude | 50.8% | AI assistant |
| ChatGPT | 48.2% | AI assistant |
| Claude Code | 38.4% | AI coding |
| Figma Make | 34.8% | AI prompt-to-app |
| FigJam | 34.0% | Whiteboard |
| Slack | 32.7% | Communication |
| Gemini | 32.3% | AI assistant |
| Google Meet | 24.8% | Communication |
| Notion | 24.5% | Docs |
Source: UX Tools, State of Prototyping Spring 2026, n=1,478, fielded 14 March to 6 April 2026. Multi-select, so the column does not total 100%.
How Far Designers Trust AI Output
Adoption figures count whether a tool was opened. They say nothing about what the tool was allowed to do. UX Tools asked the second question too, and the answers spread across six levels.
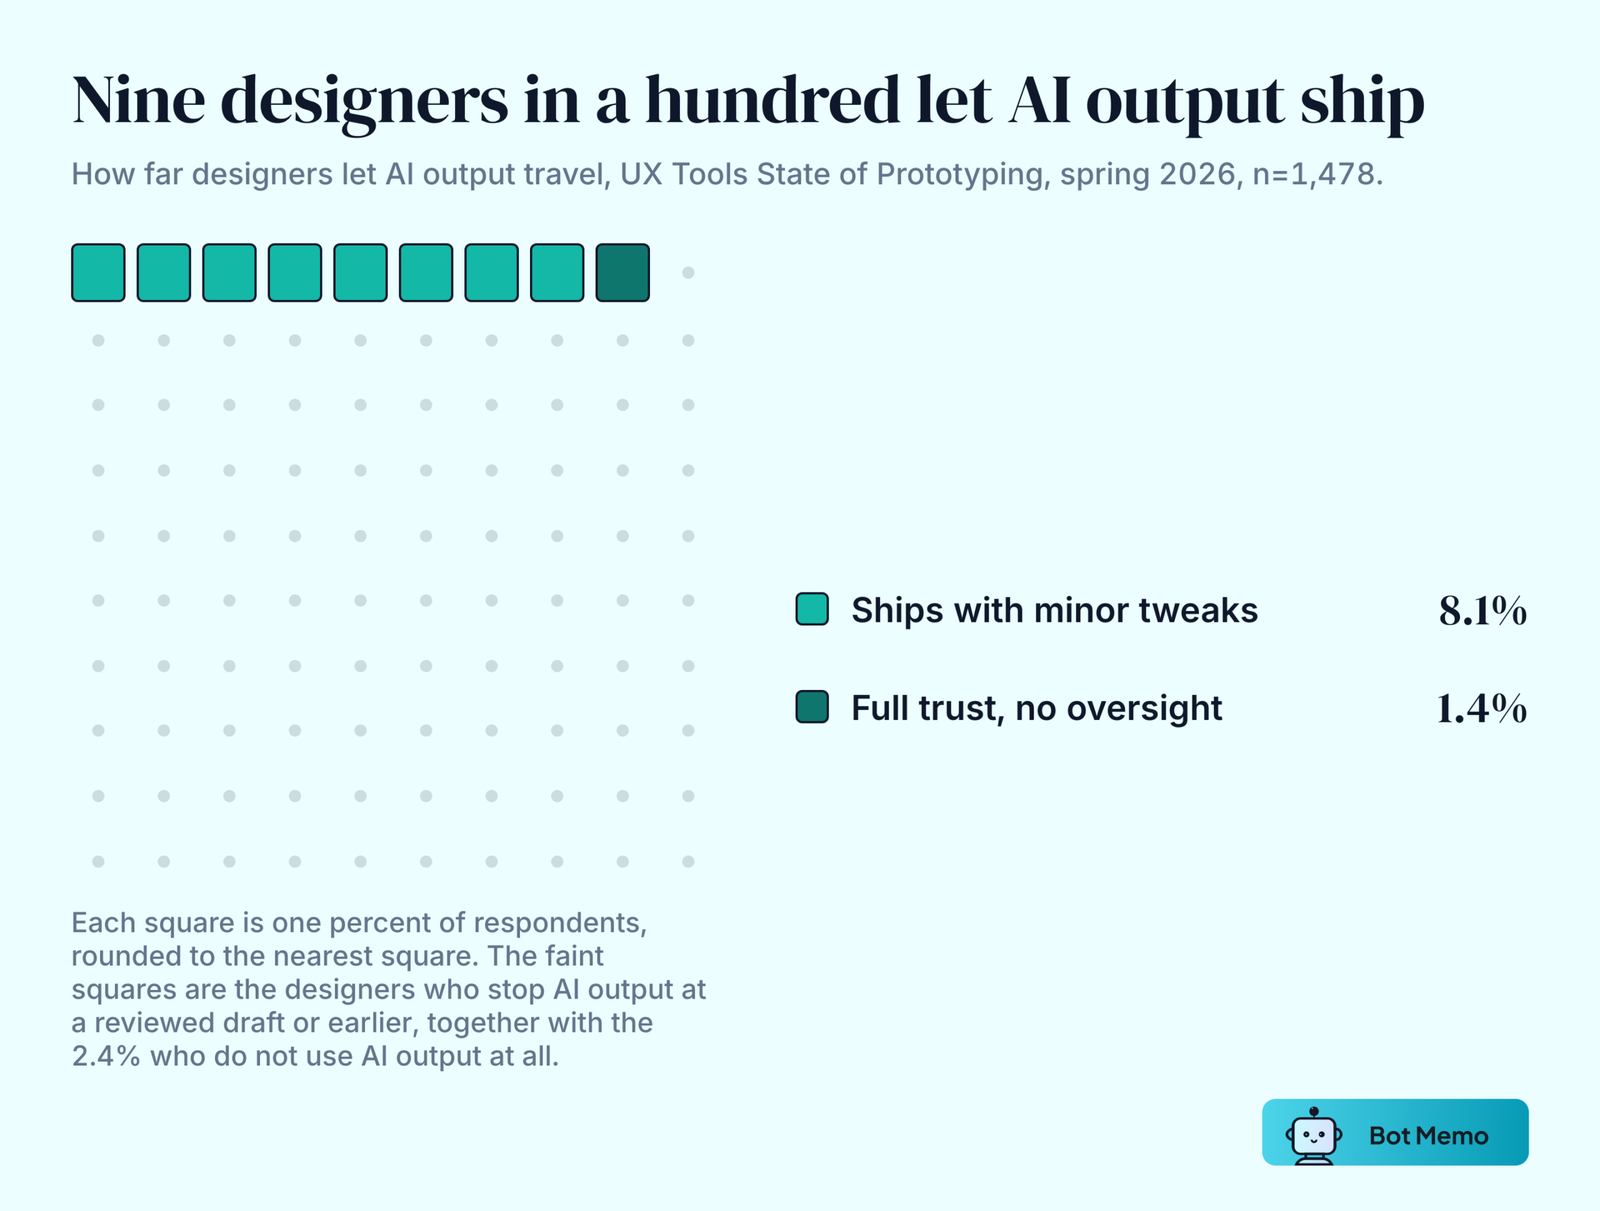
A third of respondents (34.2%) use AI output as a first draft they heavily edit. Another 29.2% keep it inside exploration and brainstorming, where nothing it produces reaches a file. A quarter (24.7%) treat it as working output they review before shipping. Only 8.1% say it ships with minor tweaks, and 1.4% grant it full trust without oversight. A further 2.4% do not use AI output at all.
So 91% weekly adoption and 9.5% ship-level trust are both true, and they describe different things. The tool is open every day. What comes out of it is treated as raw material. That matches what designers say slows them down: 52.2% name unreliable AI output as a workflow blocker, behind only the time it takes to learn new tools (55.7%) and the number of tools to evaluate (53.0%). The AI in Design Report found the same thing from a different sample, with 62% naming inconsistent or unreliable output as their biggest challenge.
Who Is Using AI Heavily
The headline adoption rate hides how unevenly the work is actually handed over. Asked what share of what they build is AI-generated, the largest single answer among UX Tools respondents was none, at 37.7%. The remaining 62.3% spread across four tiers: 18.5% occasionally, 12.7% about half, 17.5% most of it and 13.6% nearly all, which puts 43.8% at half or more.
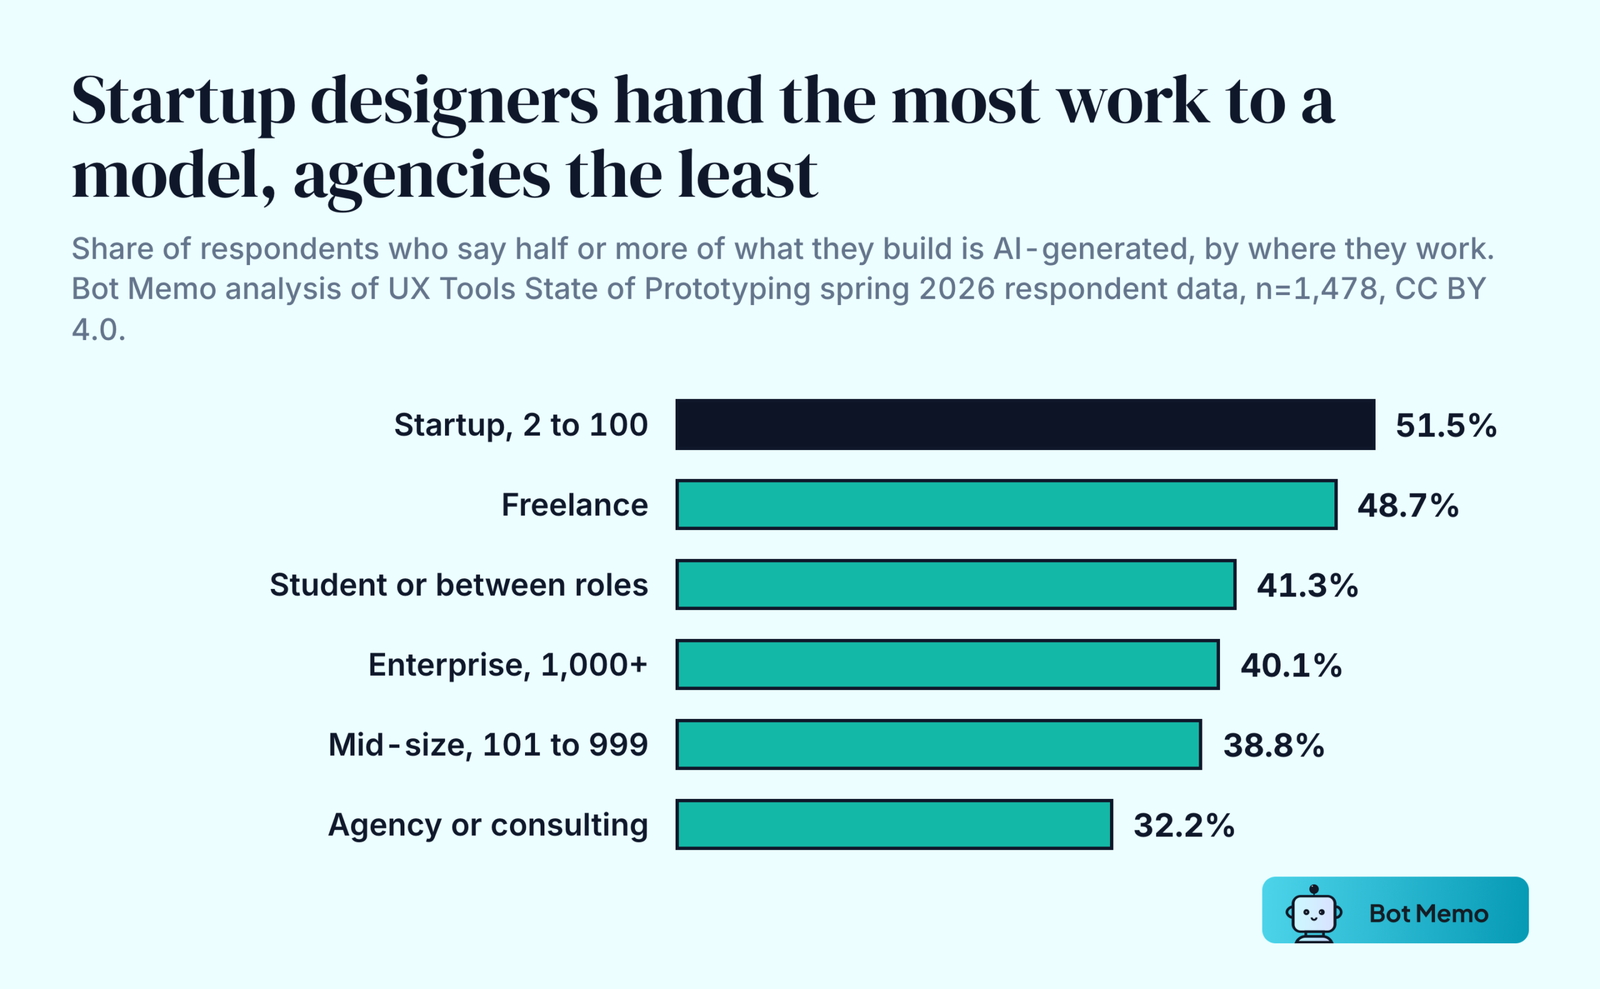
Where someone works lines up with which side they land on. We recomputed the UX Tools responses by work context, which the published summary tables do not break out.
AI-Generated Output by Where Designers Work
| Work context | Respondents | Half or more AI-generated | None AI-generated | Mean workflow satisfaction |
|---|---|---|---|---|
| Startup, 2 to 100 people | 433 | 51.5% | 30.5% | 6.63 |
| Independent or freelance | 265 | 48.7% | 34.7% | 6.62 |
| Student, educator or between roles | 92 | 41.3% | 43.5% | 5.97 |
| Enterprise, 1,000+ people | 262 | 40.1% | 42.0% | 6.58 |
| Mid-size, 101 to 999 people | 227 | 38.8% | 44.9% | 6.43 |
| Agency or consulting | 199 | 32.2% | 40.7% | 6.24 |
Bot Memo analysis of UX Tools, State of Prototyping Spring 2026 respondent-level data, n=1,478, published under CC BY 4.0. Satisfaction is the mean of a 1 to 10 self-rating.
Respondents at small startups are 60% more likely to put AI behind half or more of their output than those at agencies, 51.5% against 32.2%. Agencies are the slowest group in the sample on this measure. The survey does not ask why.
Job title splits the population harder than company size does. Among the 94 design engineers in the sample, 80.9% generate half or more of their output with AI. Among the 862 individual-contributor designers, 35.0% do. The same divide runs through how people feel about their prospects: 50.0% of design engineers say AI has made them more valuable and 10.6% feel less secure, while individual-contributor designers split 24.8% more valuable against 32.4% less secure. Researchers, at 17.4% against 39.1%, are the most pessimistic group, though with only 23 of them in the sample that reading is directional.
Satisfaction tracks adoption in the same direction. Designers who generate none of their output with AI rate their workflow 5.93 out of 10. Designers who generate nearly all of it rate it 7.39. Across the whole sample the mean is 6.49, and 59.1% have built their own tool with AI in the previous six months.
AI and Design Jobs
The US Bureau of Labor Statistics updated its design occupation projections on 27 August 2026, and its two design categories now point in opposite directions.
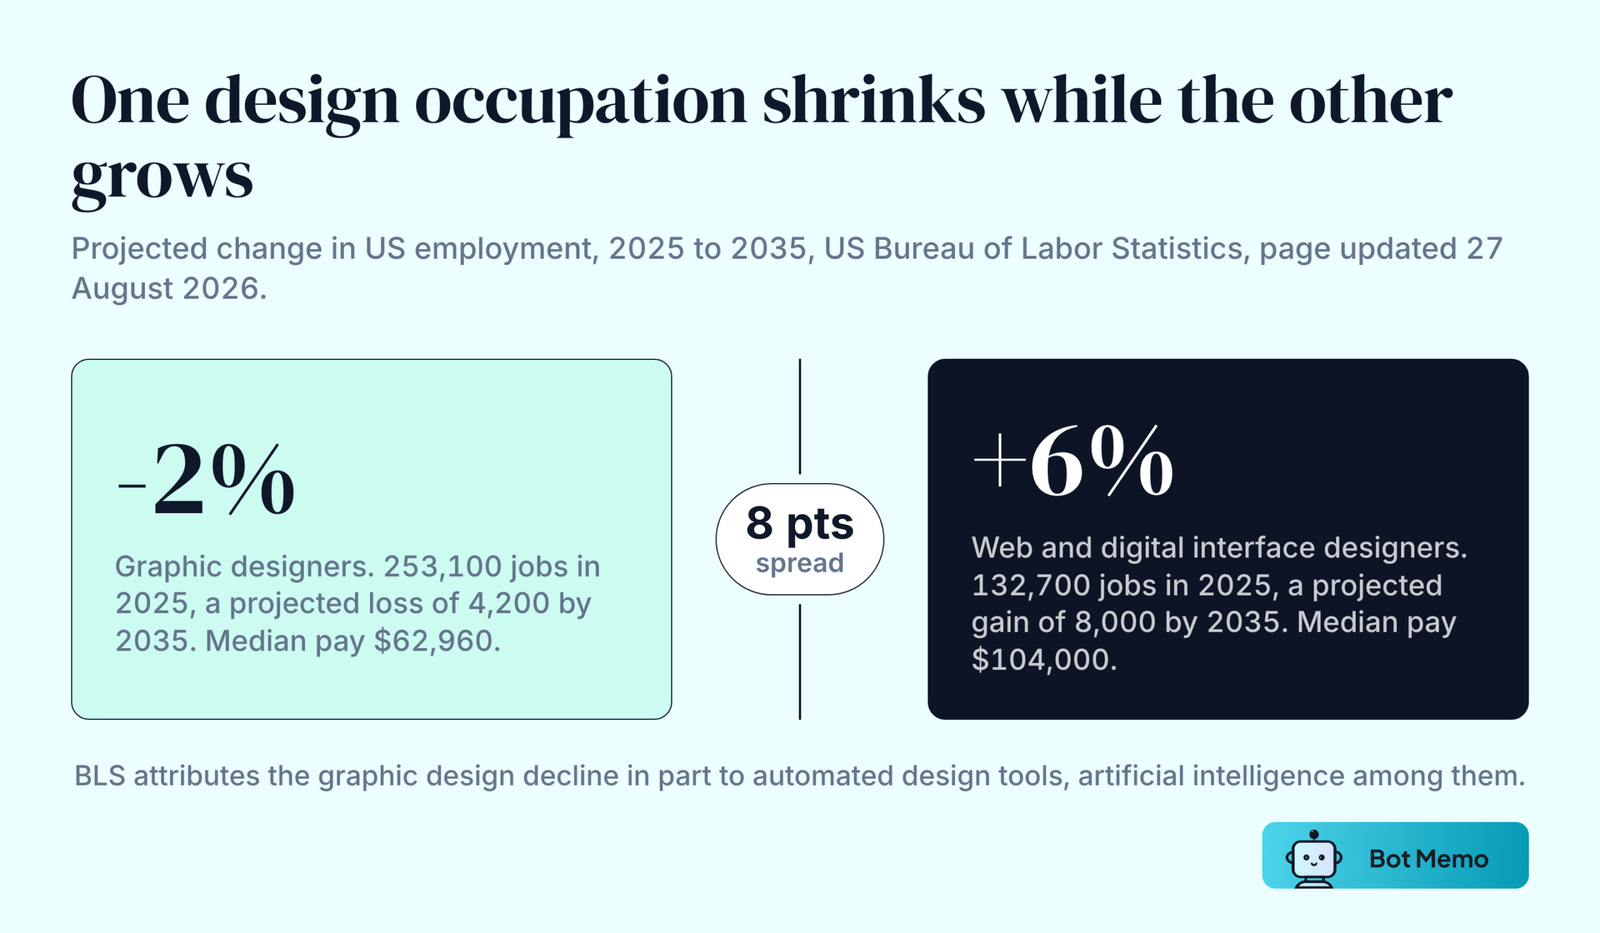
Graphic designers held 253,100 US jobs in 2025 at a median wage of $62,960. BLS projects that to fall 2% by 2035, a net loss of 4,200 positions, and states the reason plainly: automated design tools, artificial intelligence among them, are projected to make graphic designers more productive and reduce the need for these workers. About 16,000 openings are still projected each year, and BLS expects all of them to come from replacing workers who transfer to another occupation or leave the labor force, rather than from growth.
Web and digital interface designers held 132,700 jobs at a median wage of $104,000, and BLS projects 6% growth to 2035, a gain of 8,000 positions. Web developers, counted separately, are projected to grow 4%. BLS covers the two together at 5% growth and adds that improving web development tools and increasing use of AI for web development may soften that, but the sign is still positive.
The wage gap between the two occupations is $41,040. The 2026 survey data sits alongside that: the designers closest to interface and code work report both the highest AI adoption and the least worry about their prospects. Design engineers are also the group most likely to generate half or more of their output with AI, and the least likely to feel less secure. That is an association in a single survey rather than a measured effect of AI on anyone’s job.
What the Design Platforms Report
Two public companies and one large private one disclose enough to check the survey data against revenue.
Adobe
Adobe reported record Q3 FY2026 revenue of $6.76 billion on 10 September 2026, up 13%, with total annualized recurring revenue of $27.50 billion. AI-first ARR grew more than 150% year over year, and management put the figure at more than $650 million on the earnings call. Firefly ARR across the Firefly app and credit packs grew 40% quarter over quarter. Monthly active users across Adobe passed one billion, up more than 20%.
Adobe’s last published cumulative Firefly figure is more than 22 billion assets, stated on 24 April 2025. Higher numbers circulate in secondary roundups. None of them trace back to Adobe, so this page stops at 22 billion.
Figma
Figma’s Q2 2026 revenue was $370.1 million, up 48% and the third straight quarter of accelerating growth. Net dollar retention was 136%. Customers paying more than $10,000 a year grew 34% to 15,964, and customers above $100,000 grew 46% to 1,635. More than 80% of the $10,000-plus group consumes AI credits weekly, and more than half were using Figma’s agent weekly as of 31 July 2026. Figma guided full-year 2026 revenue to $1.463 billion to $1.467 billion and ran a GAAP operating loss of $117.3 million in the quarter.
Canva
Canva is private and discloses on its own schedule. Its 2025 review, published 16 December 2025, reported 260 million people using Canva every month, $3.5 billion of revenue, 95% of the Fortune 500 as customers and 100 million monthly education users. On 16 September 2026 it pulled Affinity, Cavalry, Flourish and Leonardo into a single Canva ProSuite aimed at professional creatives, and kept the core Affinity and Cavalry applications free.
The more useful Canva number for 2026 is the one that went the wrong way. In a shareholder update covered by Startup Daily on 5 August 2026, chief executive Melanie Perkins reported second-quarter revenue of $921.9 million, up 25.2%, and cut the full-year growth forecast from 30% to 20%. The reason she gave was cost: the average cost of serving an AI task was too high and the company had been leaning too heavily on frontier models. Canva says it has since cut the cost of serving an AI task by about 90%, with its own video model running 17 times cheaper than a frontier alternative and its image model 30 times cheaper.
Investors repriced it. Blackbird and AirTree marked their Canva holdings down 17%, from $42 billion to $34.9 billion, and the independent valuation Canva uses to price its annual employee share sale fell from $38.9 billion to $31 billion over the year. Neither is a transaction. Nobody bought or sold Canva at those prices.
Reported Figures Side by Side
| Company | Latest revenue | Growth | Users | AI metric disclosed |
|---|---|---|---|---|
| Adobe | $6.76B (Q3 FY2026) | +13% | 1B+ MAU | AI-first ARR above $650M, more than +150% YoY |
| Figma | $370.1M (Q2 2026) | +48% | Not disclosed | 80%+ of $10K+ customers use AI credits weekly |
| Canva | $921.9M (Q2 2026) | +25.2% | 260M monthly, as of Dec 2025 | Cost of serving an AI task cut about 90% |
Sources linked above. The three are not comparable: Adobe and Figma report audited quarters, while Canva’s figures come from a company blog post and a shareholder update reported in the press.
AI Design Market Size Forecasts
Every market-size number for AI in design is one firm’s definition rather than a measurement, and the definitions are far apart.
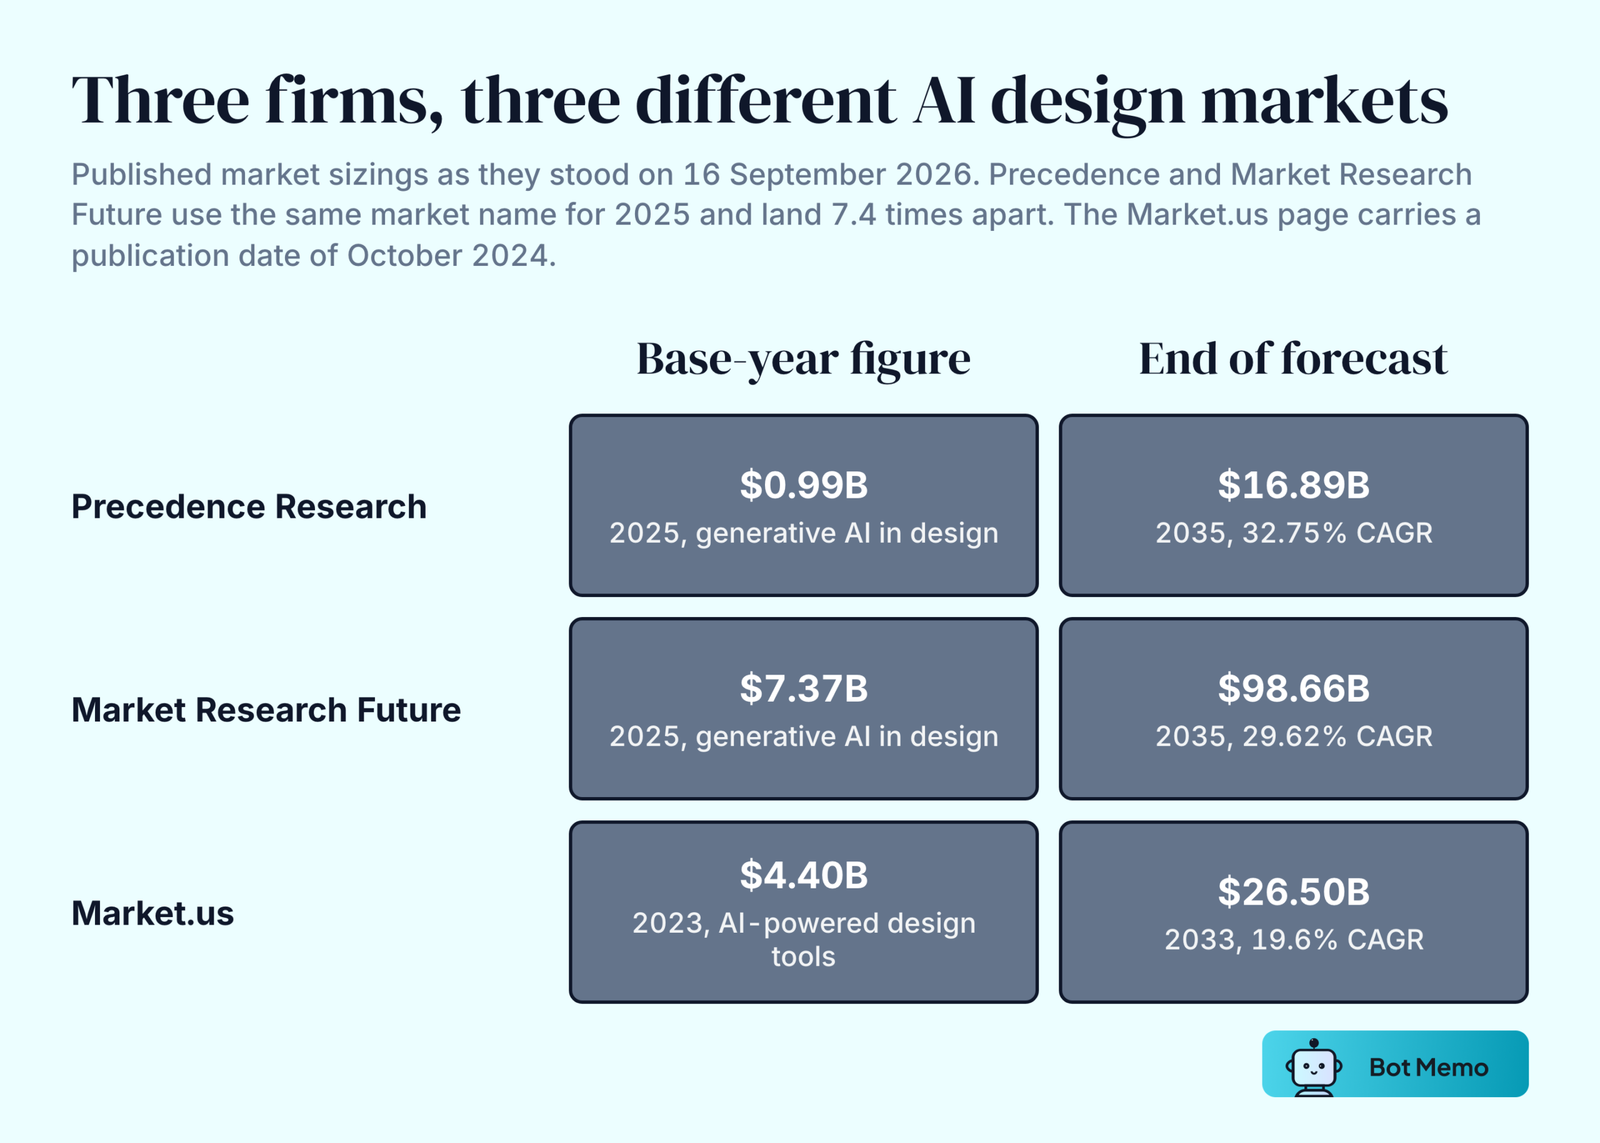
Precedence Research, in an edition updated 6 January 2026, puts the global generative AI in design market at $993.90 million for 2025 and $1,332.92 million for 2026, reaching $16,893.37 million by 2035 at a 32.75% CAGR across its 2026 to 2035 window. It puts North America above 40% of 2025 revenue and large enterprises above 47%.
Market Research Future sizes a market of the same name at $5.684 billion for 2024 and $7.368 billion for 2025, reaching $98.66 billion by 2035 at 29.62% across 2025 to 2035.
For 2025, under the same market name, those two firms are 7.4 times apart. Neither is arithmetically wrong. They are counting different things. Both name companies they say are in the market, Precedence including Autodesk, IBM, Microsoft and Bentley Systems and Market Research Future including Adobe, Autodesk, NVIDIA, Canva, Corel, Figma, Sketch, DeepArt and Runway, but neither publishes a sample size or a report-specific method, so there is no way to check which revenue those names are supposed to represent.
Market.us is quoted often enough to include, with $4.4 billion in 2023 growing to $26.5 billion by 2033 at 19.6%. Its report page carries a publication date of October 2024 and shows no later revision, so it predates every 2025 and 2026 figure on this page.
Adobe alone exited Q3 FY2026 with more than $650 million of AI-first annualized recurring revenue. Precedence sizes the entire generative AI design market at $993.90 million for 2025 and $1.33 billion for 2026. One company’s AI run rate is within reach of a whole market as one firm defines it, which says more about the definition than about Adobe.
Funding for AI Design Startups in 2026
Eight 2026 rounds are set out below, all of them raised by companies whose core product is a design tool or a visual generation engine used in creative production. Within this selection the largest went to asset generation rather than to design workflow.
Selected 2026 Rounds in Design and Visual AI
| Company | Amount | Round | Date | Lead or named investors | What it makes |
|---|---|---|---|---|---|
| Tripo AI | 3 billion yuan, about $445M | Series B and B+ | 1 Sep 2026 | MPCi | Generative 3D asset creation |
| Higgsfield | $400M at a $5.4B valuation | Series B | 17 Aug 2026 | DST Global | AI video and image creation |
| Meshy | Nearly $400M at a $1.5B valuation | Series B | 21 Jul 2026 | IDG Capital, Matrix Partners China, Monolith Management | Text and image to 3D models |
| Runway | $315M at a $5.3B valuation | Series E | 10 Feb 2026 | General Atlantic | Video generation and editing |
| Noon | $44M | Seed, per press coverage | 1 Apr 2026 | Chemistry, First Round, SV Angel and three others | Design canvas that works on top of production code |
| Paper | $34M | Series A | 23 Jul 2026 | Accel and ICONIQ | Design canvas shared by people and agents |
| ComfyUI | $30M at a $500M valuation | Not labeled | 24 Apr 2026 | Craft Ventures | Open-source node-based visual AI engine |
| Intelligence, maker of Design Arena | $7.9M | Seed | 3 Aug 2026 | Index Ventures | Human-preference benchmark for AI-generated design |
Each round above was confirmed on 16 September 2026 against the source linked in its row, which is the company or wire announcement where one exists and press coverage otherwise. Noon’s round label comes from press coverage rather than from the company post. Amounts are as announced, in the currency announced.
Four companies in that list raised more than $300 million, and all four generate pixels, video or geometry. Noon and Paper, the two building the surface a designer works in, raised $44 million and $34 million. The list is a selection rather than every round in the category, but within it the money went to output rather than to workflow.
The smallest round on the list points at the same thing from the other side. Index Ventures led $7.9 million into a company whose product is a public arena where people vote on which model produced the better design. Human judgment about what looks right is now a thing investors will fund as infrastructure. For adjacent coverage, see our AI video generation startups and AI sales and marketing startups breakdowns.
Frequently Asked Questions
What Percentage of Designers Use AI in 2026?
91% of respondents use AI at least weekly and 75% use it daily, according to the AI in Design Report 2026, which surveyed more than 900 designers across 60-plus countries in the first quarter of 2026. A year earlier the weekly figure was 54%. The sample is weighted toward product designers at technology companies, so read it as that population rather than as every designer.
Do Designers Trust AI Output?
Rarely at ship quality. In UX Tools’ Spring 2026 survey of 1,478 designers, 1.4% grant AI full trust without oversight and 8.1% say its output ships with minor tweaks. The largest group, 34.2%, treats it as a first draft they heavily edit.
Which AI Tools Do Designers Use Most?
After Figma at 82.6% weekly use, the leaders are Claude (50.8%), ChatGPT (48.2%), Claude Code (38.4%) and Figma Make (34.8%). Five of the ten most-used weekly tools are AI tools, per UX Tools’ Spring 2026 survey of 1,478 designers.
Is AI Replacing Graphic Designers?
US graphic design employment is projected to fall 2% between 2025 and 2035, a net loss of 4,200 jobs from a 2025 base of 253,100, and the Bureau of Labor Statistics attributes part of that to automated design tools including AI. Over the same decade BLS projects web and digital interface design to grow 6%. The work is moving rather than disappearing.
How Much Do Designers Earn?
US median pay in 2025 was $62,960 for graphic designers and $104,000 for web and digital interface designers, per BLS.
How Big Is the AI Design Market?
Forecasts do not agree. Precedence Research sizes generative AI in design at $993.90 million for 2025; Market Research Future sizes a market of the same name at $7.368 billion for the same year. That is a 7.4x gap driven by what each firm counts as in scope.
How Much AI Revenue Does Adobe Report?
Adobe reports a run rate rather than a revenue line. It exited Q3 FY2026 with AI-first annualized recurring revenue above $650 million, growing more than 150% year over year, against total annualized recurring revenue of $27.50 billion. Quarterly revenue was $6.76 billion, which is a different measure and not comparable to the ARR figures.
How Many People Use Canva?
260 million as of Canva’s December 2025 year in review, which also reported $3.5 billion of revenue for 2025.
Are Designers Writing Code Now?
Many are. In UX Tools’ Spring 2026 survey of 1,478 designers, 63.1% use AI or no-code tools to generate code and 59.1% have built their own tool with AI in the previous six months. Figma’s 2026 AI Report found the share of its respondents taking part in development doubled over the past year to 41%, while the share of developers doing design work rose from 44% to 60%.
Notes on the Figures
All dollar figures are USD unless the row says otherwise. Survey results carry their sample size and fielding window because they are not interchangeable: two surveys published by a design-tool vendor, one survey of prototyping-focused designers and one weighted toward product designers at startups measure different populations and different things. Only the AI in Design Report publishes a weekly adoption rate, so the Figma studies do not corroborate it, and no survey on this page should be read as a measurement of the profession as a whole.
Respondent-level figures broken out by work context are Bot Memo’s own analysis of the UX Tools Spring 2026 dataset, which the publisher releases under CC BY 4.0. Recomputing their published summary tables from the released responses reproduces those tables to within a tenth of a point, which is the check that the breakouts are sound.
Market-size forecasts are the least reliable numbers here and are labeled as forecasts throughout, with the publisher, base year and window attached to each. Totals from different firms are not additive and their growth rates are not interchangeable.
Last updated 16 September 2026. For related market work, see our generative AI market statistics and AI startup glossary.

About the author
Editorial Staff
The Editorial Staff at Bot Memo is a team of writers, analysts, and AI agents dedicated to mapping the global AI startup ecosystem. Led by Chintan Zalani, the team tracks thousands of funding rounds, classifies companies across verticals, and distills it all into actionable intelligence for investors and founders.