


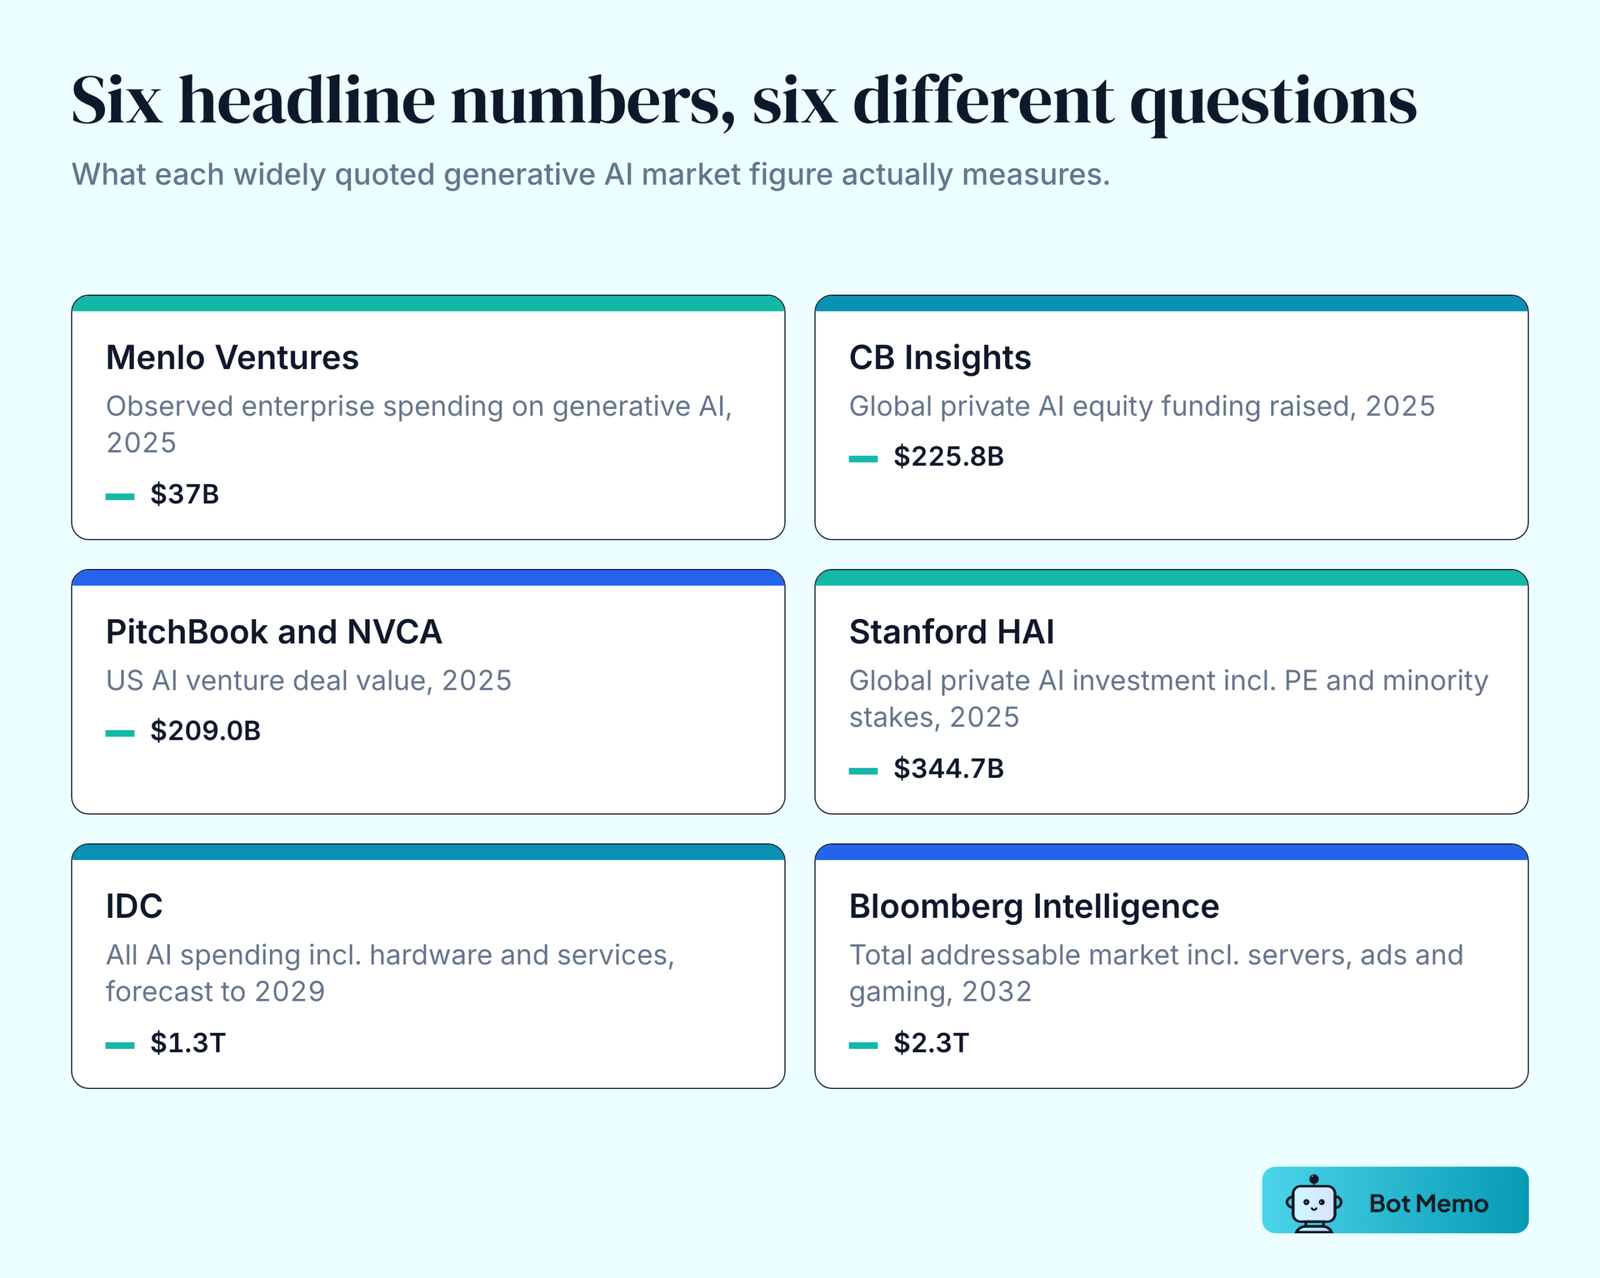
Ask five research firms how big the generative artificial intelligence market is and you get five answers between $37 billion and $2.3 trillion. Both ends are correct. Menlo Ventures counts what enterprises actually spent on generative AI in 2025. Bloomberg Intelligence counts a 2032 total addressable market that includes servers, storage, advertising and gaming. Anyone quoting one figure without saying which one they mean is measuring something they have not defined.
The generative AI statistics below each carry an issuer and a date. Where a 2023 or 2024 figure has since been overtaken, the original stays next to the current one.
On this page
- Generative AI Market Size And Growth Statistics
- Generative AI Adoption Statistics
- Generative AI Investment And Funding Statistics
- Generative AI ROI And Business Impact Statistics
- Generative AI Statistics For Sales, Marketing And Customer Service
- Generative AI Use Cases By Business Function
- Generative AI Market Share Statistics By Vendor And Model
- Generative AI Compute, Cost And Regulation Statistics
- Key Takeaways
- Frequently Asked Questions
- Sources And Methodology
Generative AI Market Size And Growth Statistics
What Enterprises Actually Spend On Generative AI
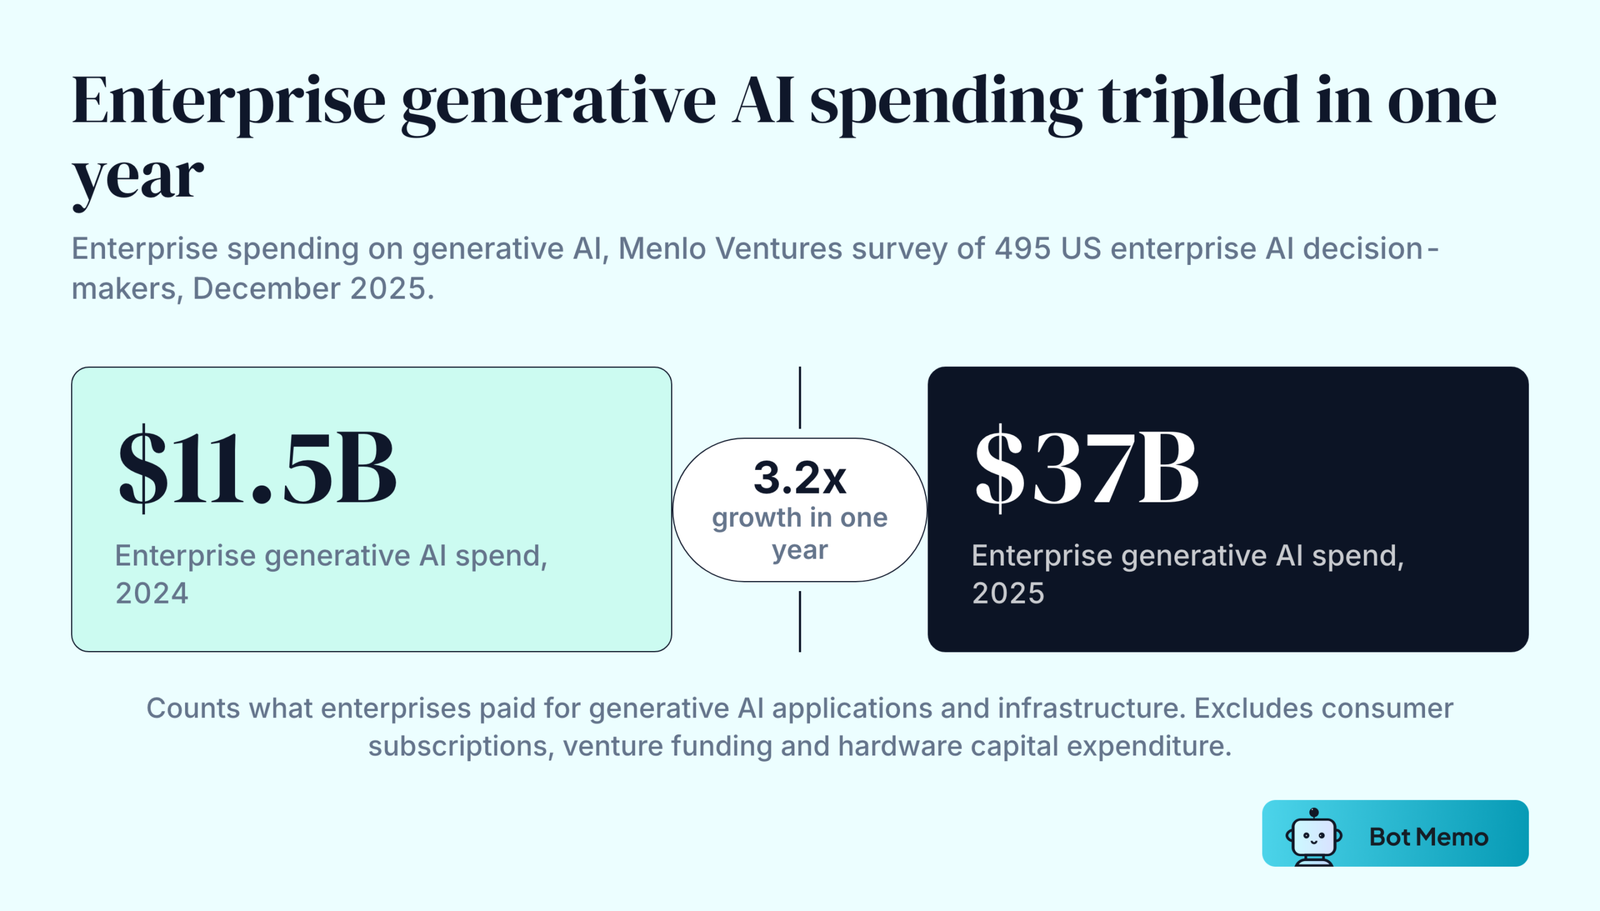
1. Enterprise spending on generative AI reached $37 billion in 2025, up from $11.5 billion in 2024, a 3.2x increase in one year. (Menlo Ventures, December 9, 2025)
2. Applications took $19 billion of that spend and infrastructure took $18 billion. (Menlo Ventures)
3. AI applications now capture 6% of the global SaaS market, three years after ChatGPT launched. (Menlo Ventures)
4. At least 10 AI products generate more than $1 billion in annual recurring revenue, and 50 products clear $100 million. (Menlo Ventures)
5. The 2025 figure comes from a survey of 495 US enterprise AI decision-makers at companies already using AI tools, fielded November 7 to 25, 2025. The 2024 comparison came from 600 US IT decision-makers at enterprises with 50 or more employees, fielded September 24 to October 8, 2024. (Menlo Ventures)
Generative AI Market Forecasts Through 2032
6. Bloomberg Intelligence puts the generative AI market at $2.3 trillion by 2032, or 22% of total technology spending across hardware, software, services and adjacent categories. (June 4, 2026)
7. That forecast has been raised three times since it was first published: $1.3 trillion (June 2023), $1.6 trillion (November 2024), $1.8 trillion (March 2025), $2.3 trillion (June 2026). (Bloomberg Intelligence)
8. The original June 2023 forecast carried a 42% compound annual growth rate from a $40 billion 2022 base. The November 2024 update put the rate at 37% through 2032. (Bloomberg Intelligence)
9. Inference rather than training is now the dominant revenue driver. Bloomberg Intelligence projects the inference market compounds at 32% a year to reach $1.3 trillion by 2032. (June 2026)
10. The training market was projected to reach $470 billion by 2032 in the earlier edition, growing faster than inference in the near term. (Bloomberg Intelligence)
11. In the November 20, 2024 edition, training and infrastructure accounted for about 40% of the projected 2032 generative AI market, and devices and applications running inference for about 30%. (Bloomberg Intelligence)
12. That same edition projected generative AI expanding to 10% to 12% of total information technology hardware, software, services, advertising and gaming spend by 2032. The June 2026 outlook restates the share as 22% of total technology spending, which is a wider denominator rather than a revision of the same measure. (Bloomberg Intelligence)
Inside The Bloomberg Total Addressable Market
13. AI servers are the largest single line at $317.4 billion by 2032. (Bloomberg Intelligence, November 20, 2024)
14. Conversational AI products reach $114.3 billion by 2032, and computer vision AI products $63.5 billion. (Bloomberg Intelligence)
15. AI storage reaches $59.1 billion by 2032. (Bloomberg Intelligence)
16. Generative AI driven advertising spend reaches $209.0 billion by 2032, which is why this forecast runs so far ahead of software-only estimates. (Bloomberg Intelligence)
17. Cloud training compute reaches $110.7 billion, inference and fine-tuning $121.1 billion, and networking $36.9 billion. (Bloomberg Intelligence)
18. Computer vision and conversational AI products emerge as new categories for inferencing, given domain-specific large language models. (Bloomberg Intelligence)
19. Hyperscale suppliers including Meta, Microsoft, Alphabet, Nvidia and Amazon are among the main facilitators for training large language models. (Bloomberg Intelligence)
All-AI Spending Forecasts
20. IDC projects worldwide AI spending growing at a 31.9% compound annual rate from 2025 to 2029, reaching $1.3 trillion by 2029. (August 26, 2025)
21. IDC’s prior edition put the global AI market at about $235 billion in 2024, reaching $632 billion by 2028 at a 29.0% rate, with generative AI compounding at 59.2% to $202 billion by 2028. (August 2024)
22. AI infrastructure spending alone reached $82.0 billion in the second quarter of 2025, up 166% year over year. (IDC, October 28, 2025)
23. IDC’s spending guide covers 3 technology groups, 42 use cases, 27 industries and 9 regions. (IDC)
Earlier Market Estimates Still In Circulation
24. Market.us put the generative AI market at $255.8 billion by 2033, a 34.2% compound annual rate from a $13.5 billion 2023 base. That page has since been rewritten and now reads $54.5 billion in 2025 rising to $1,079.7 billion by 2035 at a 35.6% rate. (Market.us, 2024 and current)
25. Statista’s 2024 forecast put the generative AI market at $29 billion in 2022 and about $50 billion in 2024. (Statista, 2024)
26. The same Statista forecast put the global generative AI market at $88.35 billion by 2025. (Statista, 2024)
Generative AI Adoption Statistics
Enterprise Adoption Rates
27. 88% of organizations report regularly using AI in at least one business function, up from 78% a year earlier. (McKinsey, November 5, 2025, 1,993 respondents across 105 nations, fielded June 25 to July 29, 2025)
28. Stanford HAI’s AI Index puts organizational AI adoption at 88% in 2025. (2026 AI Index Report, April 13, 2026)
29. The March 2025 McKinsey edition recorded 78% adoption and 71% regular generative AI use, from 1,491 respondents across 101 nations fielded July 16 to 31, 2024.
30. The early 2024 edition recorded 72% adoption and 65% regular generative AI use, from 1,363 respondents fielded February 22 to March 5, 2024. (McKinsey)
31. Stanford HAI’s prior edition put organizational AI use at 78% in 2024, up from 55% the year before, citing McKinsey. (2025 AI Index Report)
32. 95% of US companies were using generative AI as of December 2024, up 12 percentage points in just over a year. (Bain, 199 respondents)
33. A Gartner poll of 1,419 executives in September 2023 found 45% piloting generative AI and 10% running it in production, 55% combined. Six months earlier the same poll read 15% piloting and 4% in production. (Gartner, October 3, 2023)
34. OpenAI has said that more than 92% of Fortune 500 companies use its products. This measures companies touching any OpenAI product, from API access to ChatGPT Enterprise, rather than generative AI adoption across the economy. (OpenAI)
35. Fortune 500 companies’ combined revenues equal two-thirds of US GDP, with a combined market capitalization of $43.0 trillion. (Fortune, 2024 list)
How Far Adoption Has Actually Scaled
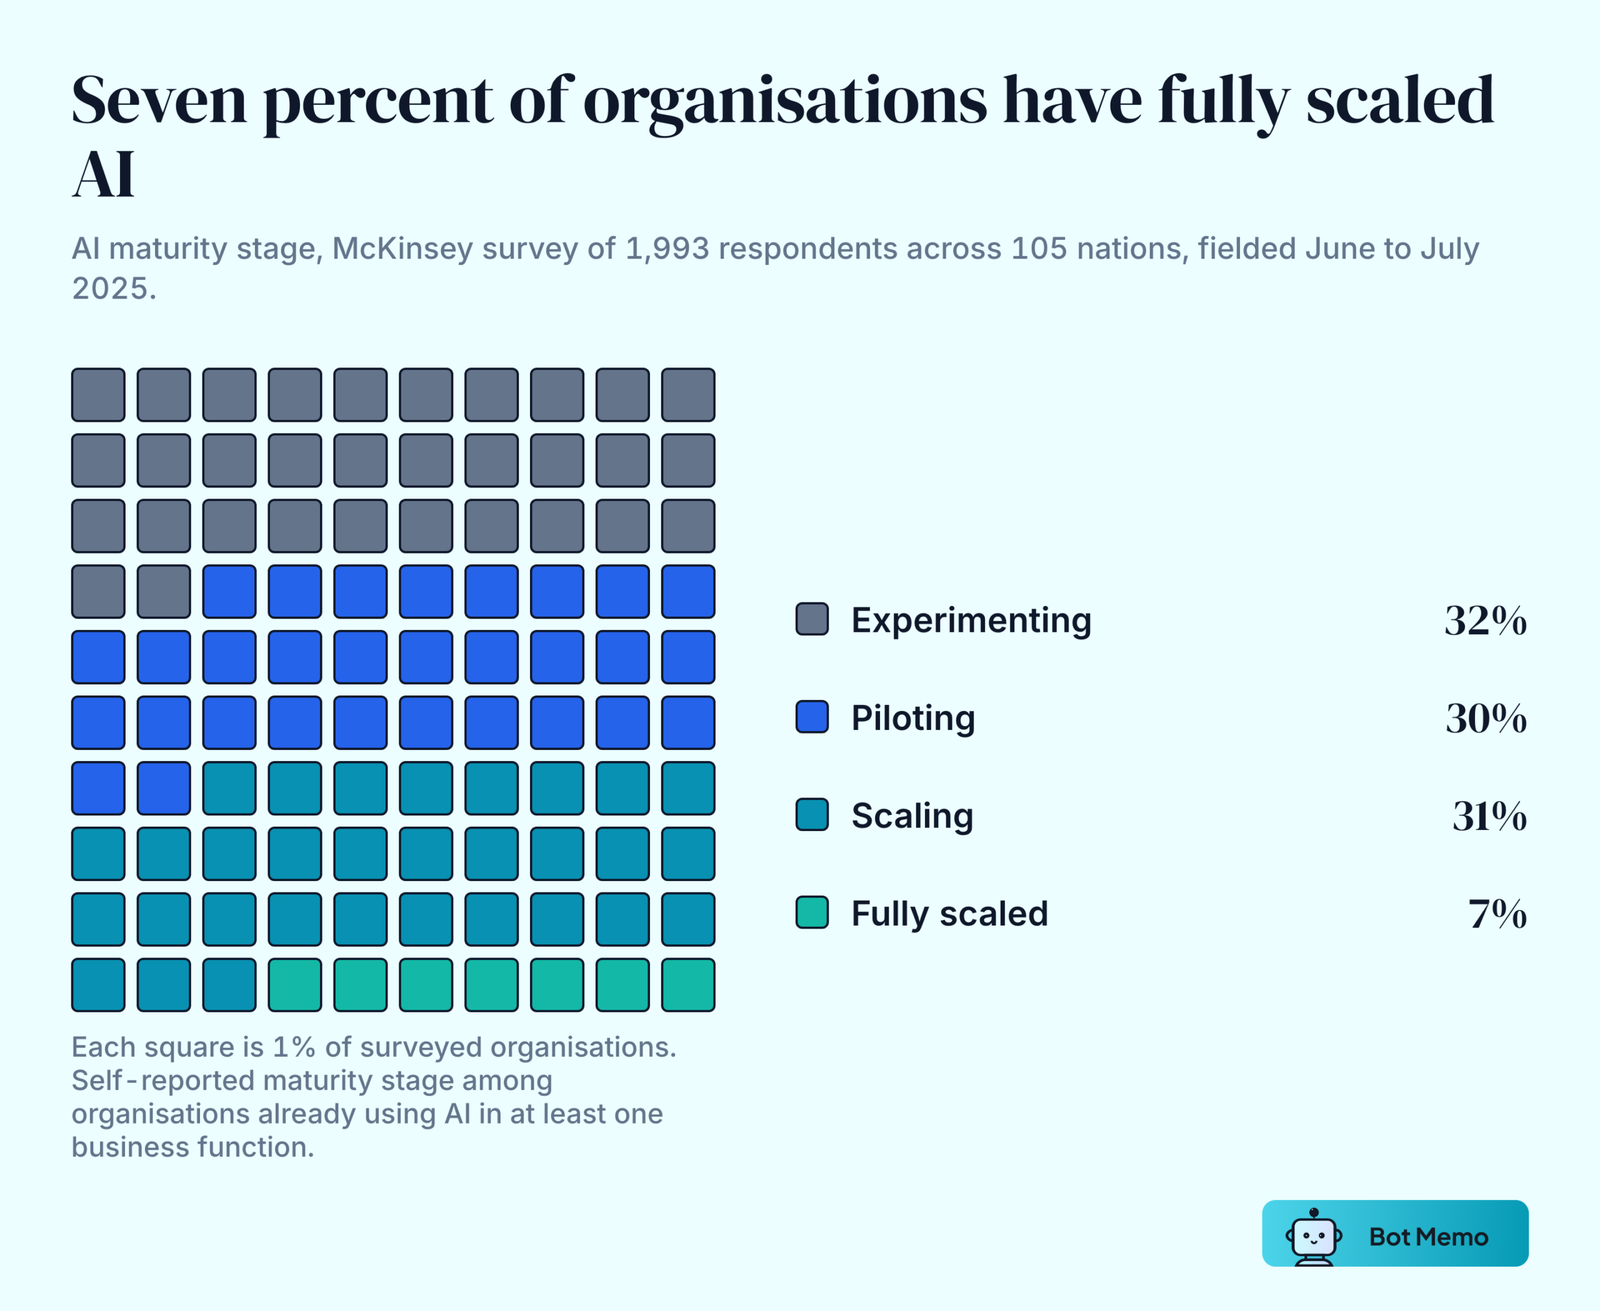
36. Only 7% of organizations have fully scaled AI. 31% are scaling, 30% are piloting and 32% are still experimenting. (McKinsey, November 2025)
37. 21% had redesigned at least some workflows around AI rather than layering it on top of existing processes. (McKinsey, March 2025)
38. Average generative AI use cases in production doubled from about 2.5 in October 2023 to about 5 in December 2024. (Bain)
39. Gartner moved generative AI into the Trough of Disillusionment in its 2025 Hype Cycle for Artificial Intelligence, down from the Peak of Inflated Expectations in 2024. (June 11, 2025)
AI Agents And Agentic AI Statistics
40. 39% of organizations are experimenting with AI agents and 23% are already scaling an agentic AI system, 62% combined. (McKinsey, November 2025)
41. No more than 10% have scaled AI agents in any individual business function. (McKinsey)
42. AI Agents and AI-Ready Data were the two fastest movers into the Peak of Inflated Expectations in Gartner’s 2025 Hype Cycle for Artificial Intelligence. (June 11, 2025)
43. Agentic AI deployments across consumer and enterprise use cases approach $286 billion by 2032. (Bloomberg Intelligence, June 4, 2026)
Firm-Level Adoption In Official Statistics
44. US firm-level AI use rose from 3.7% to 5.4% between September 2023 and February 2024, measured across roughly 1.2 million employer businesses. (US Census Bureau, Business Trends and Outlook Survey)
45. About 10% of US firms were using AI in production by September 2025. A broader measure covering any business function reached 17.3% in November 2025. (Census BTOS)
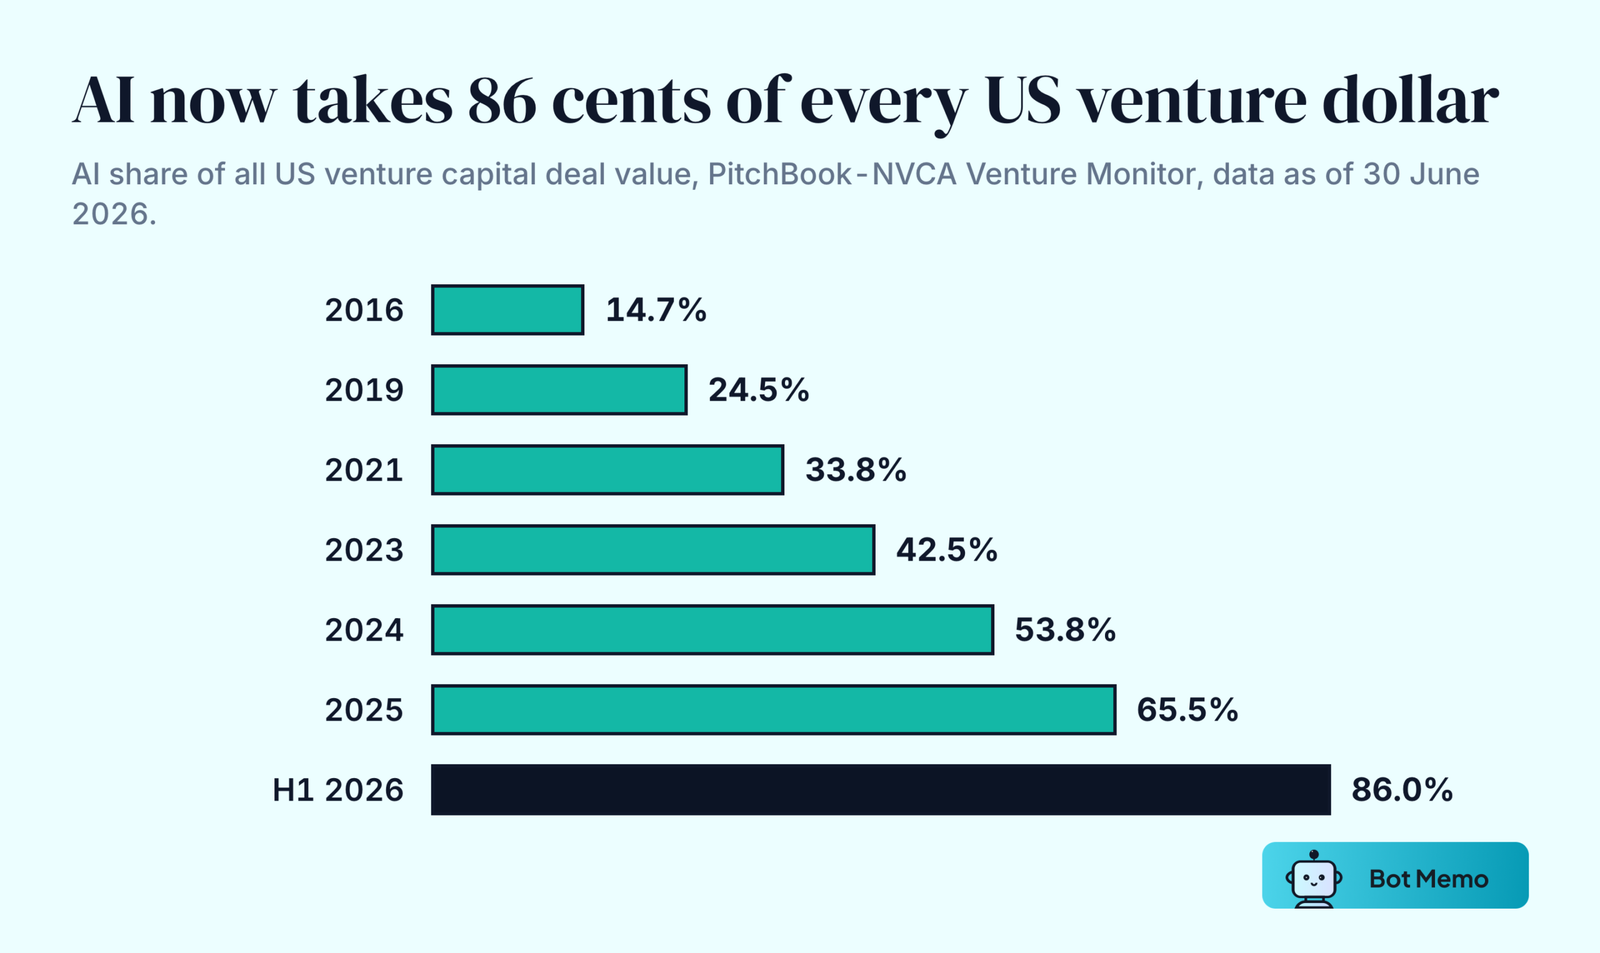
46. Across survey waves from December 14, 2025 to May 3, 2026, US business AI usage ran between 17% and 20%, with 20% to 23% expecting to adopt within the following six months. (US Census Bureau, May 26, 2026)
47. 37% of US firms with 250 or more employees reported using AI, against 32% of firms with 100 to 249 employees and under 20% of firms with four or fewer. (Census BTOS, wave ending May 3, 2026)
48. Sector spread runs from 1.4% in Construction to about 18% in Information. (Census BTOS)
Individual And Workforce Adoption
49. 54.6% of US adults aged 18 to 64 had used generative AI by August 2025, up from 44.6% in August 2024. (Bick, Blandin and Deming, Real-Time Population Survey, more than 5,000 respondents per wave)
50. Work adoption among employed respondents reached 37.4% by August 2025, up from 33.3% in August 2024. (Same study)
51. Generative AI assists 1% to 5% of all work hours, and aggregate time savings grew to 1.7% by August 2025 from 1.4% in November 2024. (Same study)
52. Generative AI adoption runs 7.5 percentage points higher for men than for women. (Same study)
53. Generative AI reached 53% population adoption in three years, faster than either the personal computer or the internet. (Stanford HAI, 2026 AI Index Report)
54. 41% of workers in ChatGPT-exposed occupations had used it for work by the end of 2023, ranging from 65% in marketing to 12% among financial advisors. (Humlum and Vestergaard, PNAS 122(1), January 2025, 18,000 usable responses from a Danish survey)
55. 70% of Gen Z report using generative AI. (Salesforce, 2023)
56. More than 85% of organizations identify increased adoption of new and frontier technologies and broadening digital access as the trends most likely to drive transformation in their organization. (World Economic Forum, Future of Jobs Report 2023)
Generative AI Investment And Funding Statistics
Global AI Investment In 2025
57. Global corporate AI investment more than doubled in 2025 to $581.7 billion. (Stanford HAI, 2026 AI Index Report)
58. Global private AI investment grew 127.5% to $344.7 billion, now 60% of total corporate AI investment. (Stanford HAI)
59. Generative AI companies captured $170.9 billion of that private investment, growing more than 200% and taking nearly half of all private AI funding. (Stanford HAI)
60. US private AI investment reached $285.9 billion against China’s $12.4 billion, a 23x gap. California alone accounted for $218 billion, more than 75% of the US total. (Stanford HAI)
61. CB Insights recorded a record $225.8 billion of global private AI funding in 2025, nearly double the 2024 total. (January 13, 2026)
62. Fourth-quarter 2025 AI funding was $83.2 billion. (CB Insights)
63. Large language model developers captured 41% of total AI investment in 2025. (CB Insights)
64. OpenAI, Anthropic and xAI raised a combined $86.3 billion in 2025, 38% of the global total. (CB Insights)
65. Mega-rounds of $100 million or more accounted for 79% of 2025 AI funding. (CB Insights)
66. 75 new AI unicorns appeared in 2025, 61% of all new unicorns, up from 32 in 2024. (CB Insights)
67. 782 AI acquisitions closed in 2025, more than 1.5 times the 2024 level. (CB Insights)
68. Stanford HAI’s prior edition put US private AI investment at $109.1 billion in 2024, with generative AI attracting $33.9 billion globally, up 18.7% from 2023. (2025 AI Index Report)
US Venture Capital And The AI Share
69. US AI venture deal value reached $354.9 billion in the first half of 2026 across 3,258 deals, out of $412.7 billion and 7,541 deals for US venture capital as a whole. (PitchBook-NVCA Venture Monitor, Q2 2026 data pack, as of June 30, 2026)
70. AI took 86.0% of all US venture deal value in that half, and 43.2% of deal count. AI sits in fewer than half of US rounds and takes almost all of the money, so the dollar share and the count share now say different things. (PitchBook-NVCA, Q2 2026 data pack)
71. The AI share of US venture deal value has climbed in every year since 2016. (PitchBook-NVCA, Q2 2026 data pack)
| Year | AI share of US VC deal value | AI share of US VC deal count |
|---|---|---|
| 2016 | 14.7% | 15.3% |
| 2019 | 24.5% | 22.9% |
| 2021 | 33.8% | 26.6% |
| 2023 | 42.5% | 32.1% |
| 2024 | 53.8% | 37.9% |
| 2025 | 65.5% | 43.3% |
| H1 2026 | 86.0% | 43.2% |
72. US AI venture deal value by year runs $12.3 billion in 2016, $70.6 billion in 2023, $115.8 billion in 2024 and $209.0 billion in 2025. (PitchBook-NVCA, Q2 2026 data pack)
73. Each edition restates the same years, so the vintage matters. The Q4 2025 data pack, which used the broader “AI and machine learning” label, put 2025 US AI deal value at $222.1 billion, 65.4% of a $339.4 billion US venture total, against 50.9% in 2024 and 10.1% in 2015. The Q2 2026 data pack narrows the label to “AI” and restates 2025 at $209.0 billion, 65.5% of a $319.2 billion total, with 2024 at 53.8%. Figures quoted from different editions will not reconcile. (PitchBook-NVCA, Q4 2025 and Q2 2026 data packs)
74. AI companies hold 47.8% of all US venture market value, $5.30 trillion of $11.09 trillion, up from 10.1% in 2016. This measures the standing value of the whole US venture-backed company base, not the money raised in a period. (PitchBook-NVCA, Q2 2026 data pack, as of June 30, 2026)
75. Median US AI venture deal value reached $6.1 million in the first half of 2026, against $5.0 million for 2025. The average reached $164.1 million against $45.2 million. (PitchBook-NVCA, Q2 2026 data pack)
76. Median non-AI deal value fell to $2.6 million in the same period, from $3.75 million in 2025. (PitchBook-NVCA, Q2 2026 data pack)
77. Median US AI deal value by series in the first half of 2026: $0.48 million pre-seed, $4.5 million seed, $22.0 million Series A, $45.0 million Series B, $80.0 million Series C, $250.0 million Series D and later. (PitchBook-NVCA, Q2 2026 data pack)
78. Median US AI pre-money valuations in the same period: $12.8 million pre-seed, $21.8 million seed, $83.0 million Series A, $267.0 million Series B, $648.0 million Series C and $4.25 billion Series D and later. (PitchBook-NVCA, Q2 2026 data pack)
| Series | Median AI deal value, H1 2026 | Median AI pre-money valuation, H1 2026 |
|---|---|---|
| Pre-seed | $0.48M | $12.8M |
| Seed | $4.5M | $21.8M |
| Series A | $22.0M | $83.0M |
| Series B | $45.0M | $267.0M |
| Series C | $80.0M | $648.0M |
| Series D and later | $250.0M | $4,250.0M |
79. The median US AI valuation step-up reached 2.19x in the first half of 2026, against 1.87x in 2025 and 1.48x in 2023. (PitchBook-NVCA, Q2 2026 data pack)
80. The first quarter of 2025 alone saw $73.6 billion across 1,603 US AI deals as first published, with OpenAI’s $40 billion round a major contributor. The Q2 2026 data pack restates that quarter at $64.6 billion across 1,895 deals. (PitchBook-NVCA, Q1 2025 and Q2 2026 data packs)
81. AI accounted for 40% of US exit value in 2025, with a record 317 AI exits. (PitchBook, Q4 2025)
82. Half of all US venture dollars went into just 0.05% of deals. (PitchBook-NVCA, Q4 2025)
How Concentrated 2026 Funding Became
83. AI startups raised $255.5 billion globally in the first quarter of 2026, past PitchBook’s full-year 2025 AI total in a single quarter. (PitchBook, May 12, 2026)
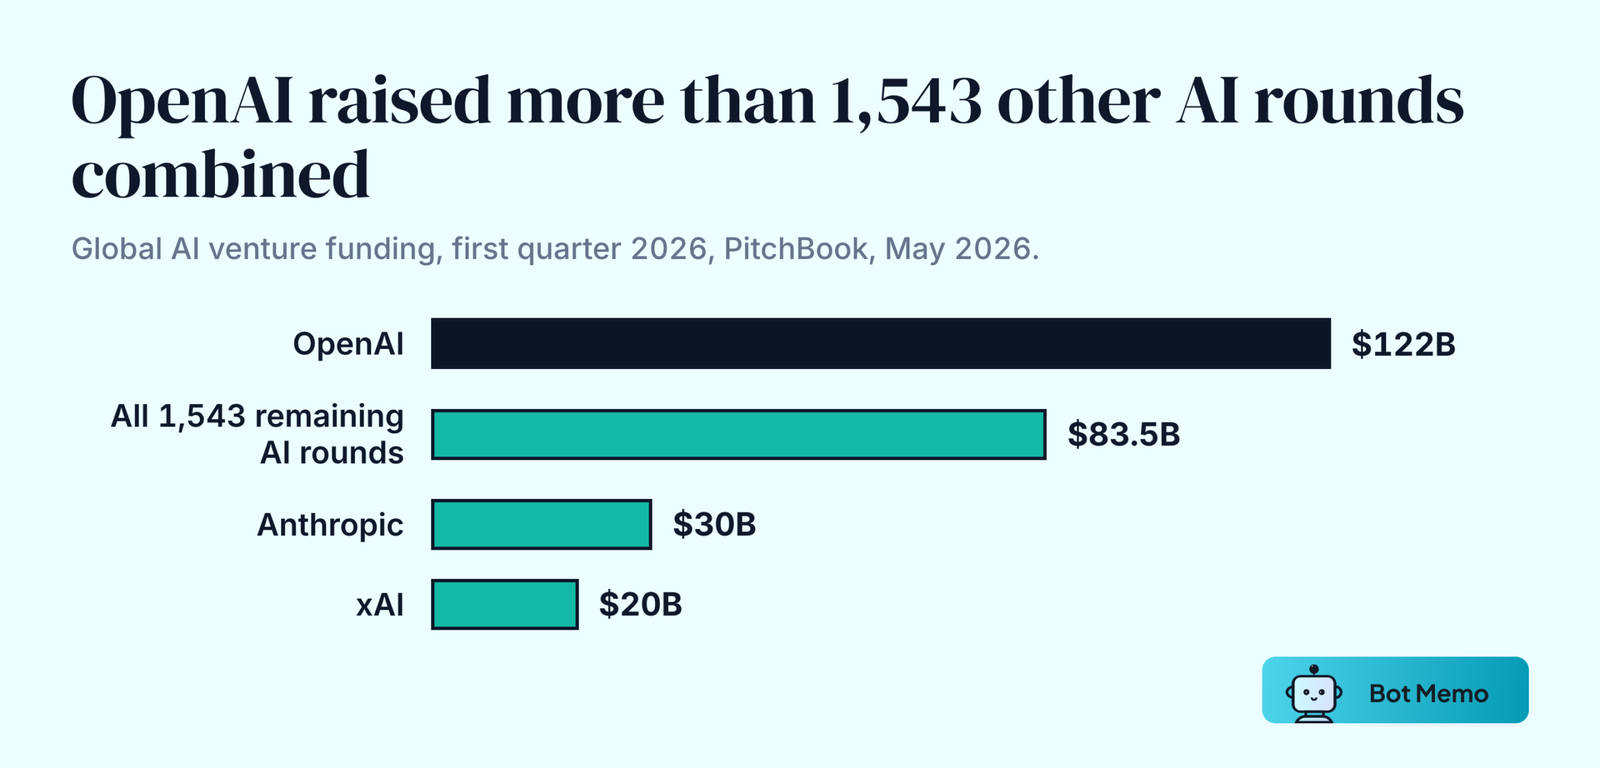
84. Three deals made $172 billion of that: OpenAI at $122 billion, Anthropic at $30 billion and xAI at $20 billion. That is 67.3% of all first-quarter AI capital, out of 1,546 deals. (PitchBook)
85. The remaining $83.5 billion was spread across 1,543 other deals. (PitchBook)
86. CB Insights recorded $226 billion of global private AI funding in the first quarter of 2026, with OpenAI’s round alone accounting for 54%. Excluding it, the quarter would have been $104 billion. (April 14, 2026)
87. Mega-rounds were 94% of first-quarter 2026 AI funding, up from 80% the prior quarter, pushing the year-to-date average deal size to $160 million. (CB Insights)
88. AI captured 79% of global venture dollars in the first quarter of 2026, and four companies took 55% of all global venture investment. (CB Insights)
89. In the second quarter of 2026, 142 mega-rounds were 6% of AI deals but took $132.5 billion, 89% of all AI dollars. (CB Insights, July 23, 2026)
90. AI minted 37 new unicorns in the second quarter of 2026, up from 32 in the first, the strongest quarter since Q2 2022. The US produced 20 of the 37. (CB Insights)
91. AI mergers and acquisitions hit 266 closed deals in the first quarter of 2026, up 90% year over year. (CB Insights)
92. Global startup investment hit a record $510 billion in the first half of 2026, above the $440 billion invested in all of 2025. (Crunchbase, July 2, 2026)
93. OpenAI and Anthropic alone accounted for $217 billion, 43% of all global startup funding in that half. (Crunchbase)
94. More than 70% of second-quarter 2026 global startup funding went to AI companies. (Crunchbase)
Capital Expenditure Behind The Models
95. The consensus 2026 hyperscaler capital spending estimate stood at $527 billion, up from $465 billion at the start of the third-quarter earnings season. (Goldman Sachs, December 18, 2025)
96. AI capital expenditure has recently equated to 0.8% of GDP, against peak levels of 1.5% of GDP or greater during other technology booms of the past 150 years. (Goldman Sachs)
97. Bloomberg Intelligence expects hyperscaler capital expenditure to approach $750 billion in 2026. (June 4, 2026)
Generative AI ROI And Business Impact Statistics
What Enterprises Report Getting Back
98. 39% of organizations report any enterprise-level impact on EBIT, meaning earnings before interest and taxes, from AI. (McKinsey, November 2025)
99. More than 80% reported no tangible enterprise-level EBIT impact from generative AI, and only 17% attributed 5% or more of EBIT to it. (McKinsey, March 2025)
100. About 5% of respondents qualified as high performers attributing more than 10% of EBIT to generative AI. (McKinsey, early 2024)
101. 74% say AI is a top-three strategic priority and 21% call it their number one, but only 23% can tie AI initiatives to new revenue or lower costs. (Bain, Q3 2025, 197 US respondents)
102. Average annual generative AI budgets doubled to about $10 million by December 2024, a 102% increase over February 2024 levels. (Bain)
103. Fewer than 30% of AI leaders report their CEOs are happy with AI investment returns, against an average generative AI spend of $1.9 million per organization in 2024. (Gartner)
104. 51% of organizations using AI have seen at least one negative consequence. (McKinsey, November 2025)
105. 44% had experienced at least one negative consequence in the early 2024 edition, with inaccuracy the most common at 23%. (McKinsey)
Measured Productivity Gains
106. Generative AI raised productivity 15% on average, measured as issues resolved per hour across 5,172 customer support agents at a Fortune 500 software firm. (Brynjolfsson, Li and Raymond, Quarterly Journal of Economics 140(2): 889-942, 2025)
107. The same study found a 34% improvement for novice and low-skilled workers, against minimal impact on experienced workers. (Same study)
108. Completion time fell 40% and output quality rose 18% in a preregistered randomized trial of 453 college-educated professionals. (Noy and Zhang, Science 381(6654): 187-192, 2023)
109. Inside AI’s frontier, 758 BCG consultants completed 12.2% more tasks, 25.1% faster, at 40% higher quality. (Dell’Acqua et al., Harvard Business School Working Paper 24-013)
110. Outside that frontier, AI users performed about 23% worse than consultants working without it. (Same study)
111. Copilot users spent 3.6 fewer hours a week on email, a 31% reduction from a pre-period average of 11.7 hours, across 7,137 knowledge workers at 66 large firms. (Dillon, Jaffe, Immorlica and Stanton, NBER Working Paper 33795)
112. The same trial found no significant change in meeting time. Workers kept attending the same meetings for the same durations. (Same study)
113. ChatGPT has had no significant impact on earnings or recorded hours in any occupation, with effects larger than 2% ruled out two years after launch. (Humlum and Vestergaard, NBER Working Paper 33777)
The Macroeconomic Read
114. Goldman Sachs finds no meaningful relationship between productivity and AI adoption at the economy-wide level, with median gains near 30% confined to customer support and software development. (March 2026)
115. A record 70% of S&P 500 companies discussed AI on their fourth-quarter calls, and 1% quantified an earnings impact. (Goldman Sachs)
116. Fewer than 20% of US establishments were using AI for any business function at that point, per Census data. (Goldman Sachs)
117. Jan Hatzius told the Atlantic Council that AI capital expenditure contributed “basically zero” to US GDP growth in 2025, because roughly 75% of the cost of a data center comes from imported parts. (March 2026)
118. Daron Acemoglu estimates only 23% of AI-exposed tasks will be cost-effective to automate within ten years, about 4.6% of all tasks, lifting US productivity 0.5% and GDP 0.9% cumulatively over the decade. (Goldman Sachs, Top of Mind issue 129, June 25, 2024)
119. In the same report, Goldman economist Joseph Briggs estimates AI automates 25% of work tasks, raising US productivity 9% and GDP 6.1% cumulatively over the decade. (Goldman Sachs)
120. Goldman’s own internal test had AI update historical data in company models faster than doing it manually, but at six times the cost. (Jim Covello, Goldman Sachs)
121. Generative AI could expose 300 million full-time jobs to automation. (Goldman Sachs, 2023)
122. Survey respondents revised their automation expectations to 42% of business tasks automated by 2027, down from about 47% predicted in 2020. (World Economic Forum, Future of Jobs Report 2023)
123. AI could create 97 million new roles against 85 million displaced by 2025. That figure comes from the Future of Jobs Report 2020, published October 2020, not the 2023 edition it is often attributed to. (World Economic Forum)
124. The Future of Jobs Report 2025 projects 170 million new roles and 92 million displaced by 2030, a net gain of 78 million. Different methodology and timeframe, so it is not a revision of the 97 million figure. (World Economic Forum, January 2025)
125. 60% of global respondents expect AI to change how they do their job within five years. (Stanford HAI 2025 AI Index, Ipsos survey of 23,685 adults across 32 countries)
Generative AI Statistics For Sales, Marketing And Customer Service
Generative AI Statistics In Marketing
126. 51% of marketers are already using generative AI, with a further 22% planning to start soon. (Salesforce, 2023)
127. 71% say generative AI will eliminate busy work, and 71% say it will let them focus on more strategic work. (Salesforce)
128. 31% ranked accuracy and quality as their top concern, ahead of trust at 20%, skills at 19% and job safety at 18%. (Salesforce)
129. The most common marketer uses are basic content creation (76%), writing copy (76%) and inspiring creative thinking (71%). (Salesforce)
130. 73% of marketing departments use generative AI. (Statista, 2023)
Generative AI Statistics In Sales
131. About one-third of salespeople said they used or planned to use generative AI, against 51% of marketers. (Salesforce, September 7, 2023)
132. 61% of sales professionals believe generative AI will help them serve customers better, and 61% believe it will help them sell more efficiently. (Salesforce Sales and Service Research, 2023, 1,036 sales and 1,023 service employees across the US, UK and Australia)
133. 84% of salespeople using generative AI said it helped increase sales at their organization. (Salesforce)
Customer Service And Customer Experience
134. 62% of consumers would rather talk to a chatbot than wait 15 minutes for a human agent. (Tidio, 2024). That page now reads 82% would talk to a chatbot if any waiting were involved, with 18% willing to wait 15 minutes for a live agent. (Tidio, current)
135. “There is a misconception about how easy it is to run mature, enterprise-ready, generative AI,” said Stela Solar, inaugural director of Australia’s National Artificial Intelligence Centre, in a survey of more than 300 business leaders by MIT Technology Review Insights and Telstra. (February 2024)
Generative AI Use Cases By Business Function
Where Enterprise Application Spending Goes
136. The $19 billion enterprises spent on generative AI applications in 2025 splits three ways. Departmental tools built for a specific job role took $7.3 billion, horizontal tools that cut across every function took $8.4 billion, and vertical tools aimed at a single industry took $3.5 billion. (Menlo Ventures, December 9, 2025)
Generative AI Spend By Department
137. Coding is the largest single use case in the enterprise, at $4.0 billion, or 55% of departmental generative AI spend. IT, the next largest, takes less than a fifth of that. (Menlo Ventures)
138. After coding, departmental spend runs IT at 10% or $700 million, marketing at 9% or $660 million, customer success at 9% or $630 million, design at 7% and HR at 5%. The six named functions cover about 95% of the pool, with the balance spread across departments Menlo does not break out. (Menlo Ventures)
| Function | Share of departmental generative AI spend | 2025 spend |
|---|---|---|
| Coding | 55% | $4.0B |
| IT | 10% | $700M |
| Marketing | 9% | $660M |
| Customer success | 9% | $630M |
| Design | 7% | Not stated |
| HR | 5% | Not stated |
Generative AI Market Share Statistics By Vendor And Model
Enterprise Spending By Model Provider
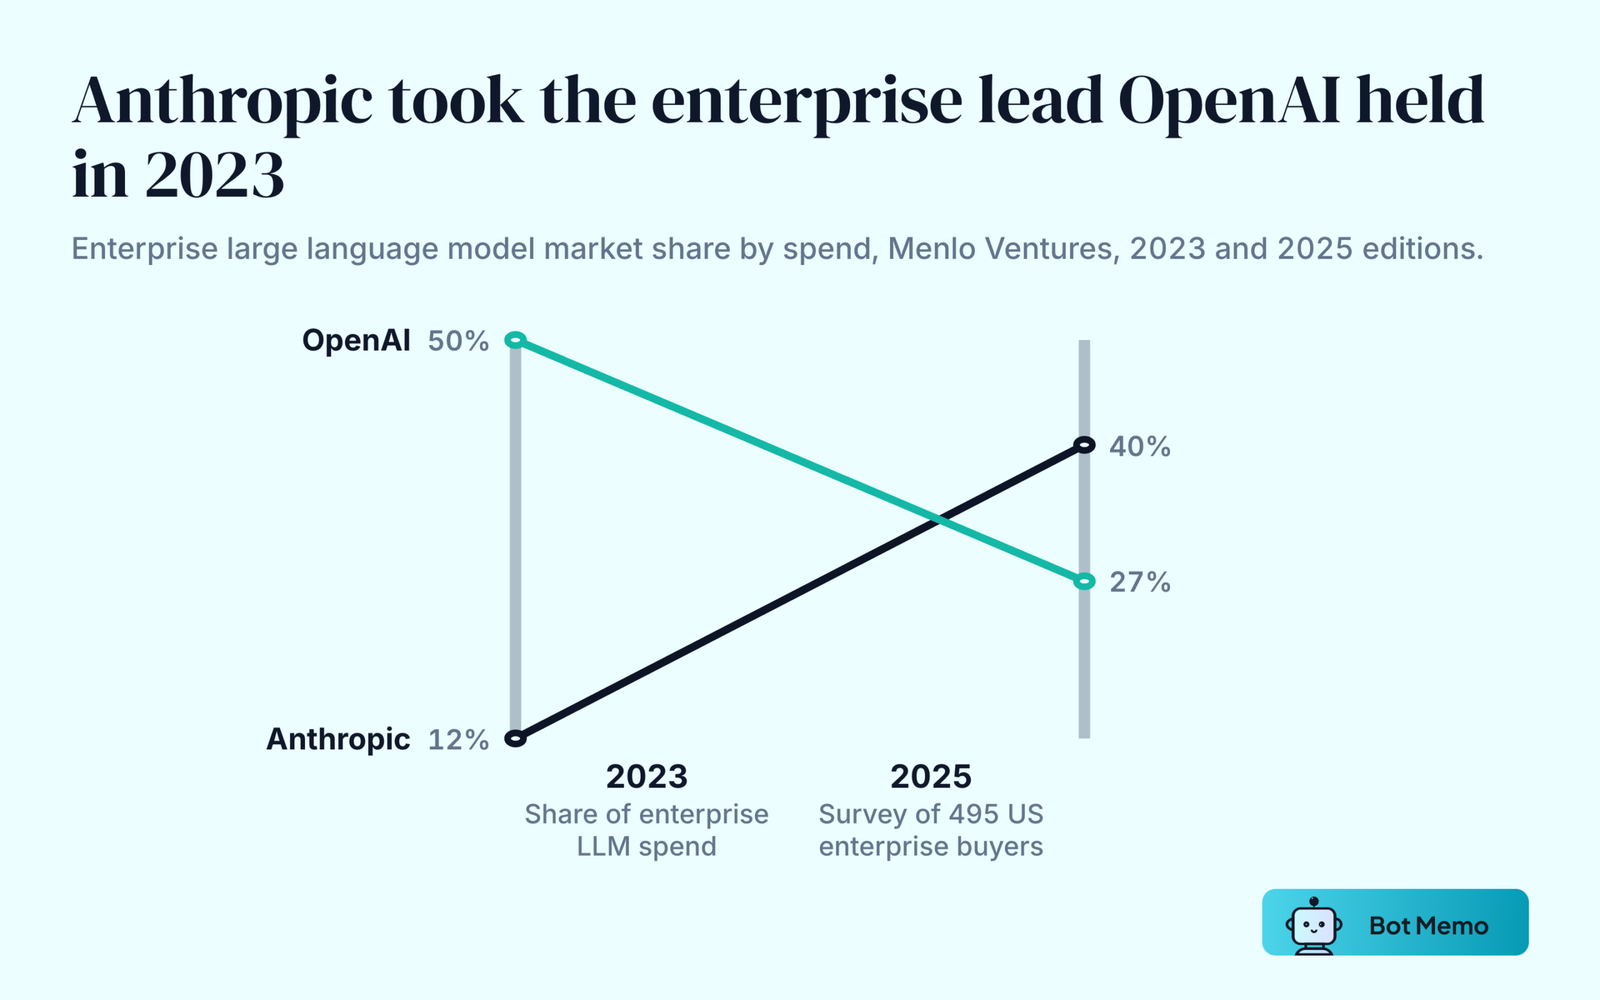
139. Anthropic holds 40% of enterprise large language model market share by spend, up from 24% in 2024 and 12% in 2023. (Menlo Ventures, December 2025)
140. OpenAI holds 27%, down from 50% in 2023. Google holds 21%, up from 7%. Open source and other providers hold 12%. (Menlo Ventures)
| Provider | 2023 share | 2025 share |
|---|---|---|
| Anthropic | 12% | 40% |
| OpenAI | 50% | 27% |
| 7% | 21% | |
| Open source and other | Not stated | 12% |
141. 76% of AI use cases are now purchased rather than built internally, against 53% purchased in 2024. (Menlo Ventures)
142. Startups captured 63% of application-layer revenue, up from 36% a year earlier. (Menlo Ventures)
Infrastructure And Chips
143. NVIDIA holds 92% of the data center GPU market, unchanged between the 2023 and 2024 readings. (IoT Analytics)
144. The data center GPU market reached $49 billion in 2023 and $125 billion in 2024. (IoT Analytics)
145. OpenAI and Microsoft together held 69% of the foundation models and platforms market in December 2023, split as OpenAI 39% and Microsoft 30%. By 2024 the combined figure was 48%, with Microsoft at 39% and OpenAI at 9%. (IoT Analytics)
146. Accenture led the generative AI services market with 6% share in 2023 and 7% in 2024. (IoT Analytics)
Models By Country And Origin
147. US-based institutions produced 40 notable AI models in 2024, against China’s 15 and Europe’s 3. (Stanford HAI, 2025 AI Index Report)
148. Nearly 90% of notable AI models came from industry in 2024, up from 60% in 2023. (Stanford HAI)
149. By March 2026 the leading US model led the leading Chinese model by 2.7% on model-performance benchmarks, close to parity. (Stanford HAI, 2026 AI Index Report)
150. Scores on SWE-bench, a benchmark that asks models to resolve real GitHub issues, rose from about 60% to nearly 100% in a single year. (Stanford HAI, 2026 AI Index Report)
Generative AI Compute, Cost And Regulation Statistics
Training Compute And Cost
151. Training compute for frontier language models has grown about 5x a year since 2020, doubling roughly every 5.2 months. Across notable models since 2010 the rate is about 4.5x a year. (Epoch AI, dashboard current to February 5, 2026)
152. Training compute has grown 10 billion-fold since 2010. (Epoch AI)
153. Compute growth splits into three eras: doubling about every 20 months before deep learning, about every 6 months from roughly 2010 to 2015, and about every 10 months in the large-scale era from about 2015. (Sevilla et al., IEEE IJCNN 2022)
154. The cost to train frontier language models has risen about 3.5x a year since 2020. (Epoch AI)
155. Notable models trained on more than 10^26 FLOP, a measure of total arithmetic operations used in training, grow from about 10 in 2026 to 80 by 2028 and more than 200 by 2030 on Epoch AI’s projection.
156. Epoch AI’s Notable AI Models dataset covers more than 900 models with over 400 compute estimates. Its All AI Models dataset tracks more than 3,500 models from 1950 onward.
Falling Inference Costs
157. Inference cost for a system performing at GPT-3.5 level fell more than 280-fold between November 2022 and October 2024, from $20.00 to $0.07 per million tokens. (Stanford HAI, 2025 AI Index Report)
158. Inference costs are falling anywhere from 9x to 900x a year depending on the task. (Epoch AI)
159. Pre-training compute efficiency improves at roughly 3.0x a year. (Epoch AI)
160. GPUs have become 34% more energy efficient a year since 2008. (Epoch AI)
AI Regulation
161. US federal agencies introduced 59 AI-related regulations in 2024, more than double the 2023 count. (Stanford HAI, 2025 AI Index Report)
162. US state legislatures proposed 629 AI-related laws in 2024 and passed 131 of them. (Stanford HAI)
Key Takeaways
The gap between using generative AI and getting paid for it is the story these numbers tell. 88% of organizations report regular AI use, and 7% have fully scaled it.
74% of executives call AI a top-three priority, and 23% can tie it to revenue or cost. More than 80% saw no measurable EBIT effect. Looking at the whole US economy rather than a survey panel, there is no relationship between AI adoption and productivity outside customer support and software development.
Capital has not waited for that gap to close. AI took 86.0% of US venture deal value in the first half of 2026, against 14.7% in 2016, while appearing in only 43.2% of rounds. Three companies took $172 billion of the $255.5 billion raised globally in the first quarter alone. Counted as standing value rather than new money, AI now accounts for 47.8% of the entire US venture-backed base, up from 10.1% in 2016.
Where measured productivity gains do show up, they are real and they favor the inexperienced. Customer support agents resolved 15% more issues per hour, and novices gained 34%.
Consultants working inside the technology’s competence gained 40% on quality. Outside it, the same tool made them 23% worse. That split decides whether a deployment pays, not the headline market size.
Frequently Asked Questions
How Big Is The Generative AI Market In 2026?
It depends entirely on what is being counted. Enterprises spent $37 billion on generative AI in 2025, and private investors put $344.7 billion into AI companies that same year.
IDC forecasts $1.3 trillion of all-AI spending by 2029. Bloomberg Intelligence forecasts $2.3 trillion of generative AI total addressable market by 2032, including servers, storage, advertising and gaming. Observed spending, private funding and long-range addressable market are three different measures.
What Percentage Of AI Usage Is Generative AI?
Generative AI companies took $170.9 billion of the $344.7 billion in global private AI investment in 2025, close to half, per Stanford HAI. On the enterprise adoption side, McKinsey’s November 2025 survey found 88% of organizations regularly using AI in at least one function, with generative AI now the majority of that activity.
How Many People Use Generative AI?
54.6% of US adults aged 18 to 64 had used generative AI by August 2025, up from 44.6% a year earlier, per the Real-Time Population Survey run by Bick, Blandin and Deming. Among employed respondents, 37.4% use it for work. Stanford HAI puts global population adoption at 53% within three years, faster than the personal computer or the internet.
Why Do Most Generative AI Projects Fail To Show Returns?
The data points at scale rather than capability. Only 7% of organizations have fully scaled AI and 21% have redesigned any workflow around it, so most deployments sit alongside existing processes rather than replacing them. Bain found 74% of executives rank AI in their top three priorities while 23% can tie it to revenue or cost. Gartner recorded an average generative AI spend of $1.9 million per organization in 2024 against fewer than 30% of CEOs happy with the return.
Which Industries Lead Generative AI Adoption?
US Census data puts the Information sector at about 18% AI use against 1.4% in Construction, the widest sector gap in official statistics. Firm size matters more than sector at the margin: 37% of firms with 250 or more employees use AI, against under 20% of firms with four or fewer.
Who Has The Largest Generative AI Market Share?
By enterprise spend on large language models, Anthropic holds 40%, OpenAI 27%, Google 21% and open source 12%, per Menlo Ventures in December 2025. Two years earlier OpenAI held 50% and Anthropic 12%. In data center GPUs, NVIDIA holds 92% per IoT Analytics.
Sources And Methodology
Figures on this page come from five kinds of source, and the difference between them decides how much weight any single number carries.
Executive surveys from McKinsey, Bain, Gartner and Menlo Ventures are self-reported and sample small. McKinsey’s largest wave is 1,993 respondents, Bain’s is 197, and Menlo’s is 495. Menlo Ventures is a venture firm with AI holdings, and its 2025 sample was filtered to companies already using AI tools while the 2024 sample was not, which makes the year-over-year comparison directional rather than exact. Gartner’s Hype Cycle is a qualitative analyst framework, not a measurement.
Official statistics from the US Census Bureau cover roughly 1.2 million employer businesses and are the most representative reading of US firm-level adoption available. Its numbers run far below the survey panels, which is what a representative sample of all businesses looks like next to a panel of large-company executives.
Market forecasts from IDC and Bloomberg Intelligence measure different things under the same word. IDC’s $1.3 trillion covers all AI spending including hardware and services through 2029. Bloomberg Intelligence’s $2.3 trillion is a 2032 total addressable market that includes AI servers, storage, conversational AI devices, advertising and gaming, which is why it runs an order of magnitude above software-only estimates. Bloomberg has raised that forecast three times since 2023.
Funding trackers use incompatible definitions. CB Insights counts global private funding rounds. The PitchBook-NVCA Venture Monitor is US-only and classifies broadly across AI rather than generative AI specifically, and it narrowed that label from “AI and machine learning” to “AI” between the Q4 2025 and Q2 2026 editions. Stanford HAI’s private investment figure includes venture, private equity and minority stakes.
That is why 2025 appears as $225.8 billion, $209.0 billion and $344.7 billion depending on which is quoted. Editions also revise: the Q4 2025 Venture Monitor published $222.1 billion for 2025 US AI deal value, and the Q2 2026 data pack restates the same year at $209.0 billion under the narrower label. Every Venture Monitor figure on this page names the edition it came from, because the same year carries different numbers in different editions.
Peer-reviewed studies carry the most weight on productivity. The Quarterly Journal of Economics, Science and PNAS papers cited here are randomized or quasi-experimental with administrative outcome data, not self-assessment. They measure specific tasks at specific firms, so they do not generalize to whole-economy productivity, which is what the Goldman Sachs work above tests separately.
Figures superseded since first publication are kept on the page with their original source and date, followed by the current number, so the record stays checkable. Where a source page has been rewritten in place, both readings appear.
For related numbers, see Bot Memo’s breakdowns of AI startup funding statistics, how many companies use AI, AI startup funding by stage, the most active AI investors, the enterprise AI market map, and OpenAI statistics.

About the author
Editorial Staff
The Editorial Staff at Bot Memo is a team of writers, analysts, and AI agents dedicated to mapping the global AI startup ecosystem. Led by Chintan Zalani, the team tracks thousands of funding rounds, classifies companies across verticals, and distills it all into actionable intelligence for investors and founders.