


Search for AI ecommerce statistics and the same handful of numbers comes back on page after page. A market worth $8.65 billion. Ninety-six percent of retailers using AI. A 369% lift in average order value from AI recommendations. Not one of those three resolves to a research organisation that published a sample size, a method, and a date you can check.
The numbers that do resolve tell a sharper story. Adobe measured AI referral traffic to US retail sites up 393% year over year in the first quarter of 2026. Amazon told investors more than 300 million customers used Rufus in 2025, and that it drove nearly $12 billion in attributed sales. Seven agentic commerce products shipped inside nine months, from Mastercard, Visa, OpenAI with Stripe, Google and PayPal, and none has disclosed an exact transaction count or total transaction value.
Every AI ecommerce statistic below names the organisation that produced it, with the reporting period or publication date where the source states one. Figures are current as of 8 September 2026, and cover artificial intelligence across product discovery, personalization, conversational AI and agent-initiated checkout.
On this page
- AI Ecommerce Statistics 2026: The Headline Numbers
- AI In Ecommerce: Market Size And Traffic Statistics
- AI Adoption Statistics: How Shoppers Use AI In Ecommerce
- Conversion And Revenue Impact Statistics
- Agentic Commerce Statistics: Checkout, Protocols, And Payments
- Retail AI Adoption Statistics By Platform
- Social Commerce And AI Shopping Startup Funding
- Key Takeaways
- Frequently Asked Questions
- Sources And Methodology
AI Ecommerce Statistics 2026: The Headline Numbers
The Figures Worth Knowing First
-
US retail e-commerce sales reached $340.2 billion in Q2 2026, seasonally adjusted, per the US Census Bureau. That is up 3.8% on Q1 and 12.2% on Q2 2025.
-
E-commerce accounted for 17.1% of total US retail sales in Q2 2026, the highest share the Census Bureau has recorded.
-
Generative AI traffic to US retail sites rose 393% year over year in Q1 2026, per Adobe Analytics.
-
In March 2026, traffic arriving from AI sources converted 42% better than traffic from other sources, per Adobe. In March 2025 the same traffic converted 38% worse.
-
Amazon reported 250 million active Rufus customers in 2025, with monthly active users up 140% and interactions up 210% year over year.
-
Salesforce measured AI and agents influencing 20% of global orders during Cyber Week 2025, worth $67 billion.
-
Visa research found 47% of US shoppers now use AI tools for at least one shopping task.
-
Klarna’s AI assistant was doing the work of 853 full-time customer service agents as of Q3 2025, up from 700 in its first month of operation in early 2024.
-
Shopify recorded 750,000 shops using Sidekick for the first time in Q3 2025, against nearly 100 million cumulative Sidekick conversations.
-
Anthropic’s Project Deal, the only published experiment where AI agents transacted with no human in the loop, moved just over $4,000 across 186 deals.
The Market-Size Numbers Everyone Quotes
-
The figure “the global AI in ecommerce market is worth $8.65 billion” appears across the pages that rank for this topic. It does not match any current live research page. Precedence Research, the publisher most often credited, currently puts the market at $9.01 billion for 2025 growing to $74.93 billion by 2035, in a page updated 8 January 2026.
-
An earlier Precedence vintage still in circulation gives $6.63 billion for 2023 rising to $22.60 billion by 2032. Two figures, two end years, one publisher.
-
“AI product recommendations increase average order value by 369%” traces to a Barilliance blog page dated June 2023 that gives no sample size, no time period and no breakdown beyond “across multiple industries.” That page carries its own caveat that the nominal amount is not the significant part.
-
“AI personalization increases conversion by up to 10%” has no primary source that states it. The closest match is a McKinsey article from January 2025 describing one European telecom case where personalized messages drove 10% more engagement, which is a different metric in a different industry.
-
“Voice commerce will reach $100 billion by 2026” does not match any live forecast. Juniper Research’s published voice and conversational commerce numbers are different figures for different years.
-
The closest defensible replacement for the “96% of retailers use AI” claim is Salesforce’s survey of 1,700 retail decision-makers, which found 84% using some form of AI and 43% piloting autonomous agents.
What Nobody Has Disclosed
-
OpenAI has published no gross merchandise value, transaction count, or number of completed purchases for Instant Checkout, from the September 2025 launch through the March 2026 redesign.
-
Visa described “hundreds of secure, agent-initiated transactions” in December 2025 and gave no exact figure, no dollar value, and no per-partner breakdown.
-
Mastercard has released no merchant count and no transaction volume for Agent Pay since the April 2025 launch.
-
PayPal disclosed no transaction figures for Agentic Commerce Services and did not say how many of its merchants are agent-ready.
-
Google has published no order count or order value for agentic checkout in AI Mode, or for the Universal Commerce Protocol.
AI In Ecommerce: Market Size And Traffic Statistics
US Ecommerce Sales And Online Penetration
-
US retail e-commerce grew 12.2% year over year in Q2 2026, against 6.7% growth for total retail, per the Census Bureau.
-
That is more than double the year-over-year e-commerce growth rate of a year earlier. Q2 2025 came in at 5.0%.
-
Q4 2025 e-commerce, revised in the August 2026 release, was $318.0 billion seasonally adjusted, up 5.9% year over year and 16.7% of total US retail sales.
Generative AI Traffic To Retail Sites
-
Adobe measured AI traffic to US retail sites up 1,200% in February 2025, against a July 2024 baseline.
-
Adobe’s April 2025 reading climbed to 3,100% against that same July 2024 baseline.
-
And to 4,700% in July 2025, the figure Visa later carried into its Trusted Agent Protocol release on 14 October 2025.
-
Across the November and December 2025 holiday season, generative AI traffic to US retail sites was up 693.4% year over year, per Adobe.
-
November 2025 alone ran at 769% year over year; December 2025 at 673%.
-
Q1 2026 came in at 393% year over year, and March 2026 at 269%.
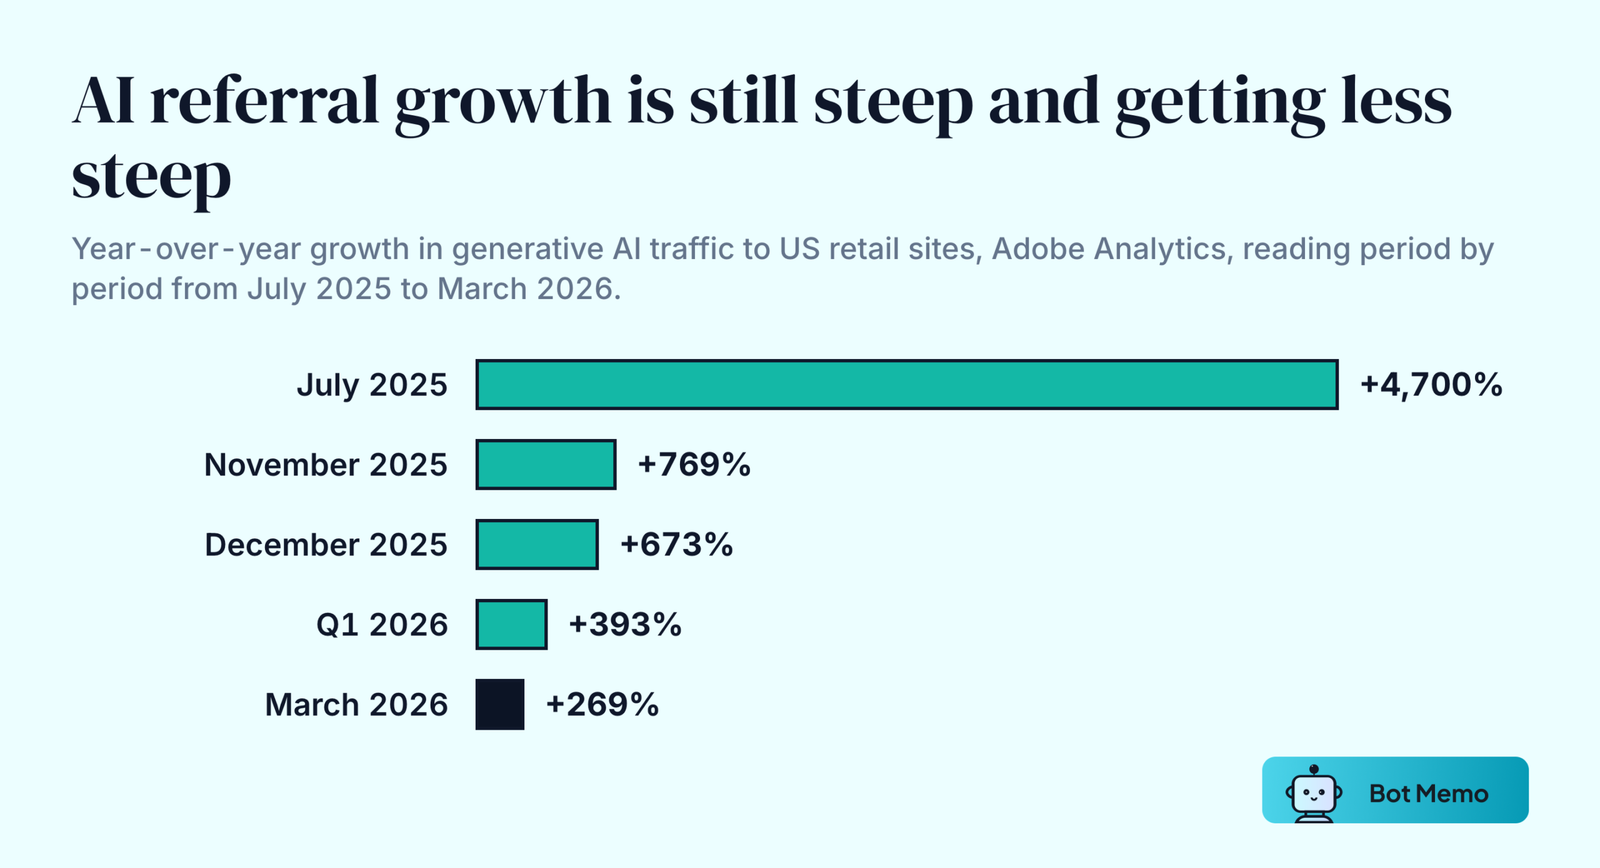
- Every one of those percentages starts from a small base, and each is measured against a different prior period, so the readings rise and fall against each other. Adobe has never published the absolute AI referral volume behind them.
Holiday 2025 And Cyber Week Spending
-
US consumers spent $257.8 billion online between 1 November and 31 December 2025, a record, per Adobe Analytics.
-
Twenty-five days of that season each exceeded $4 billion in online spend, against 18 such days in 2024.
-
Cyber Monday 2025 hit $14.25 billion, up 7.1% year over year, peaking at $16 million a minute between 8pm and 10pm.
-
The five-day Cyber Week total was $44.2 billion, up 7.7% year over year.
-
Buy Now Pay Later accounted for $20.0 billion of holiday season online spend, including $1.03 billion on Cyber Monday alone, 79.4% of it on mobile.
-
Salesforce, measuring a different population, put global Cyber Week 2025 sales at $336.6 billion, up 7%, with the US at $79.6 billion, up 5%.
AI Adoption Statistics: How Shoppers Use AI In Ecommerce
How Many Shoppers Use AI Tools To Shop
-
Visa research put US shoppers using AI for at least one shopping task at 47%.
-
Adobe’s March 2026 survey of 5,000 US consumers found 39% had used AI for online shopping.
-
Salesforce found 39% of consumers, and 54% of Gen Z, using AI for product discovery, across 8,350 shoppers in 21 countries.
-
Bain & Company put US consumers using generative AI for product research and comparison at 30% to 45%.
-
Capgemini found 58% of consumers had replaced search engines with generative AI for product research, up from 25% in 2023, across 12,000 consumers in 12 countries.
-
Salesforce measured 24% of consumers already comfortable with AI agents shopping for them, and 32% of Gen Z, in a wave of 15,015 consumers.
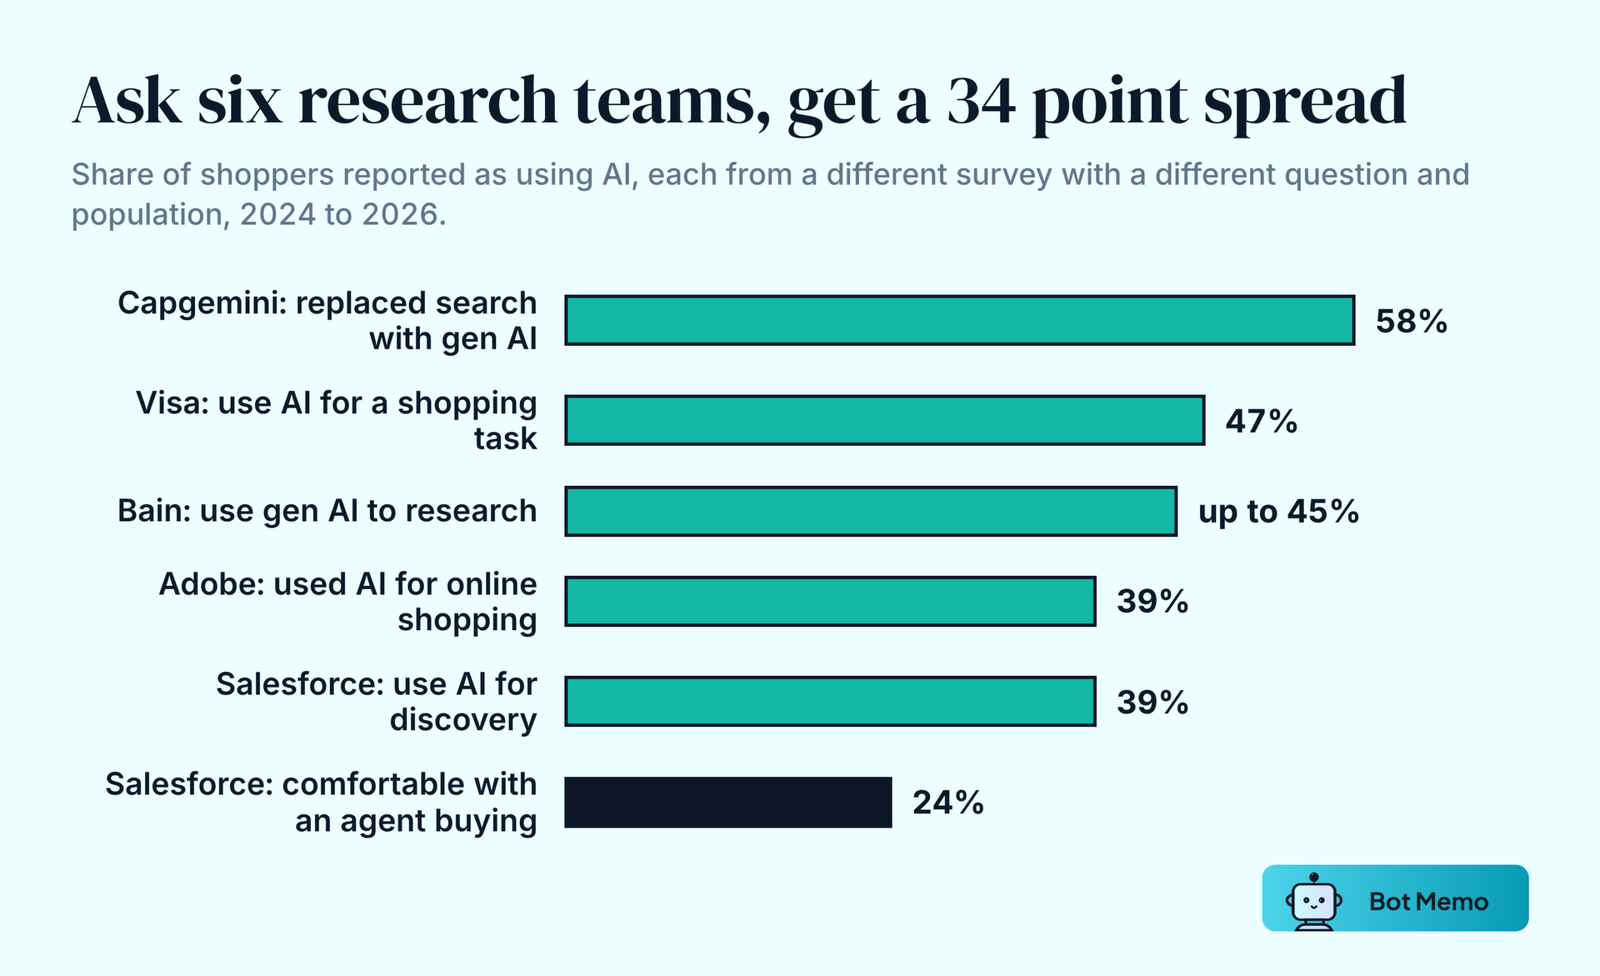
- The spread between the highest and lowest of those figures is 34 percentage points. Each survey asks a different question of a different population, so they are six readings of six things, not six readings of one.
What Shoppers Use Generative AI Tools For
-
Product research leads at 53%, per Adobe’s 2025 survey of 5,000 US consumers.
-
Product recommendations follow at 40%, then seeking deals at 36%.
-
Bain & Company found 17% of unique online shoppers planned to begin holiday shopping on an AI platform such as ChatGPT or Perplexity, against 30% who planned to start with Google search.
-
Bain’s analysis of a Sensor Tower opt-in panel found the shopping share of ChatGPT queries rising from 7.8% to 9.8% between January and June 2025, on top of roughly 70% growth in total prompts. Shopping queries roughly doubled in six months.
Trust, Comfort, And The Limits Of Delegation
-
Roughly half of US consumers are cautious about letting AI agents handle a purchase from start to finish, per Bain.
-
Capgemini found 71% of consumers want generative AI built into their shopping experiences.
-
Salesforce found 70% of consumers would use AI agents to optimise loyalty points, 67% for returns and exchanges, 66% to buy when a price drops, and 64% to monitor products for maintenance or replacement.
-
Salesforce also reported 48% of shoppers who already use AI for shopping are open to an agent making a purchase for them.
-
Adobe found 85% of shoppers who have used AI to shop say it improved their experience, a figure Visa cited in its October 2025 Trusted Agent Protocol announcement.
Conversion And Revenue Impact Statistics
How AI Referral Traffic Converts
-
In January 2025, visitors arriving from AI sources were 49% less likely to convert than other visitors, per Adobe.
-
By April 2025 that gap had narrowed to 38%, and by July 2025 to 23%, per Adobe’s August 2025 series. Adobe’s report published on 16 April 2026 gives the same 38% figure for March 2025, comparing AI-referred visits with non-AI visits that month, a separate series that lands on the same number.
-
Revenue per session from AI-referred visitors rose 84% between January and July 2025.
-
In March 2026 AI traffic converted 42% better than non-AI traffic, Adobe’s highest reported monthly reading. The flip from penalty to premium came during the second half of 2025, and over the 2025 holiday season Adobe measured AI-referred traffic converting 31% better than other sources.
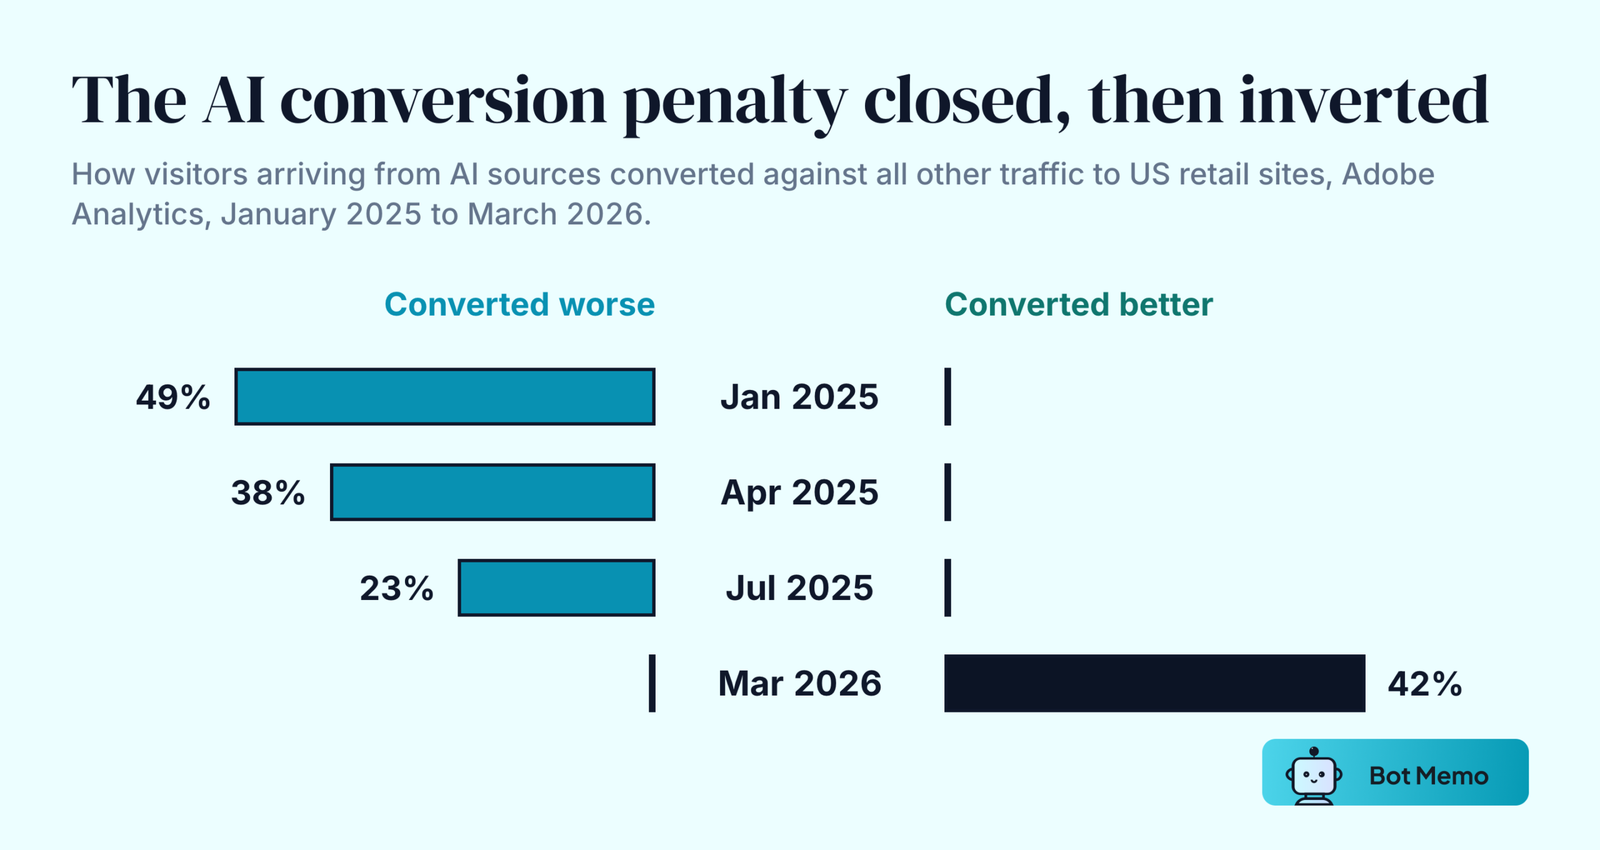
- Adobe classifies an AI source by referring URL and has not published the full list of domains it counts, so the size of the reversal depends on a definition only Adobe holds.
Engagement, Time On Site, And Returns
-
AI-referred shoppers were 33% less likely to bounce over the 2025 holiday season, per Adobe.
-
They spent 45% more time on site and viewed 13% more pages per visit.
-
Eighty-one percent of holiday AI shoppers said the tool improved their experience, and 65% said it made them more confident in the purchase.
-
Sixty-eight percent said they were less likely to return the item.
-
Adobe’s March 2026 wave found 85% of AI shoppers saying it improved their experience and 66% believing AI tools return accurate results.
AI Personalization In Ecommerce
-
Seventy percent of organisations report personalization improved over the past three years, per Adobe and Oxford Economics, who surveyed 3,000 executives and practitioners plus 4,000 customers in October and November 2025.
-
In the same study, 64% report improved lead generation and 59% improved customer retention.
-
About 36% of those organisations consider themselves ahead of their peers on digital customer experience maturity, and 57% put themselves on par with or behind them.
What AI-Influenced Orders Are Worth
-
Salesforce attributed 20% of global orders during Cyber Week 2025 to AI and agents, worth $67 billion.
-
Across the full 2025 holiday season, Salesforce put the same 20% share at $262 billion in global sales.
-
Agentforce Commerce powered nearly 61 million orders during Cyber Week 2025.
-
Retailers running Agentforce 360 with branded agents, including Pandora, Shark Ninja and Funko, grew sales 32% faster than those without. That compares adopters against non-adopters rather than a controlled test.
-
Salesforce’s definition of an AI-influenced order is broad. It covers personalized recommendations, conversational service and branded agents, not only completed agentic checkouts.
Agentic Commerce Statistics: Checkout, Protocols, And Payments
The Protocol Timeline
-
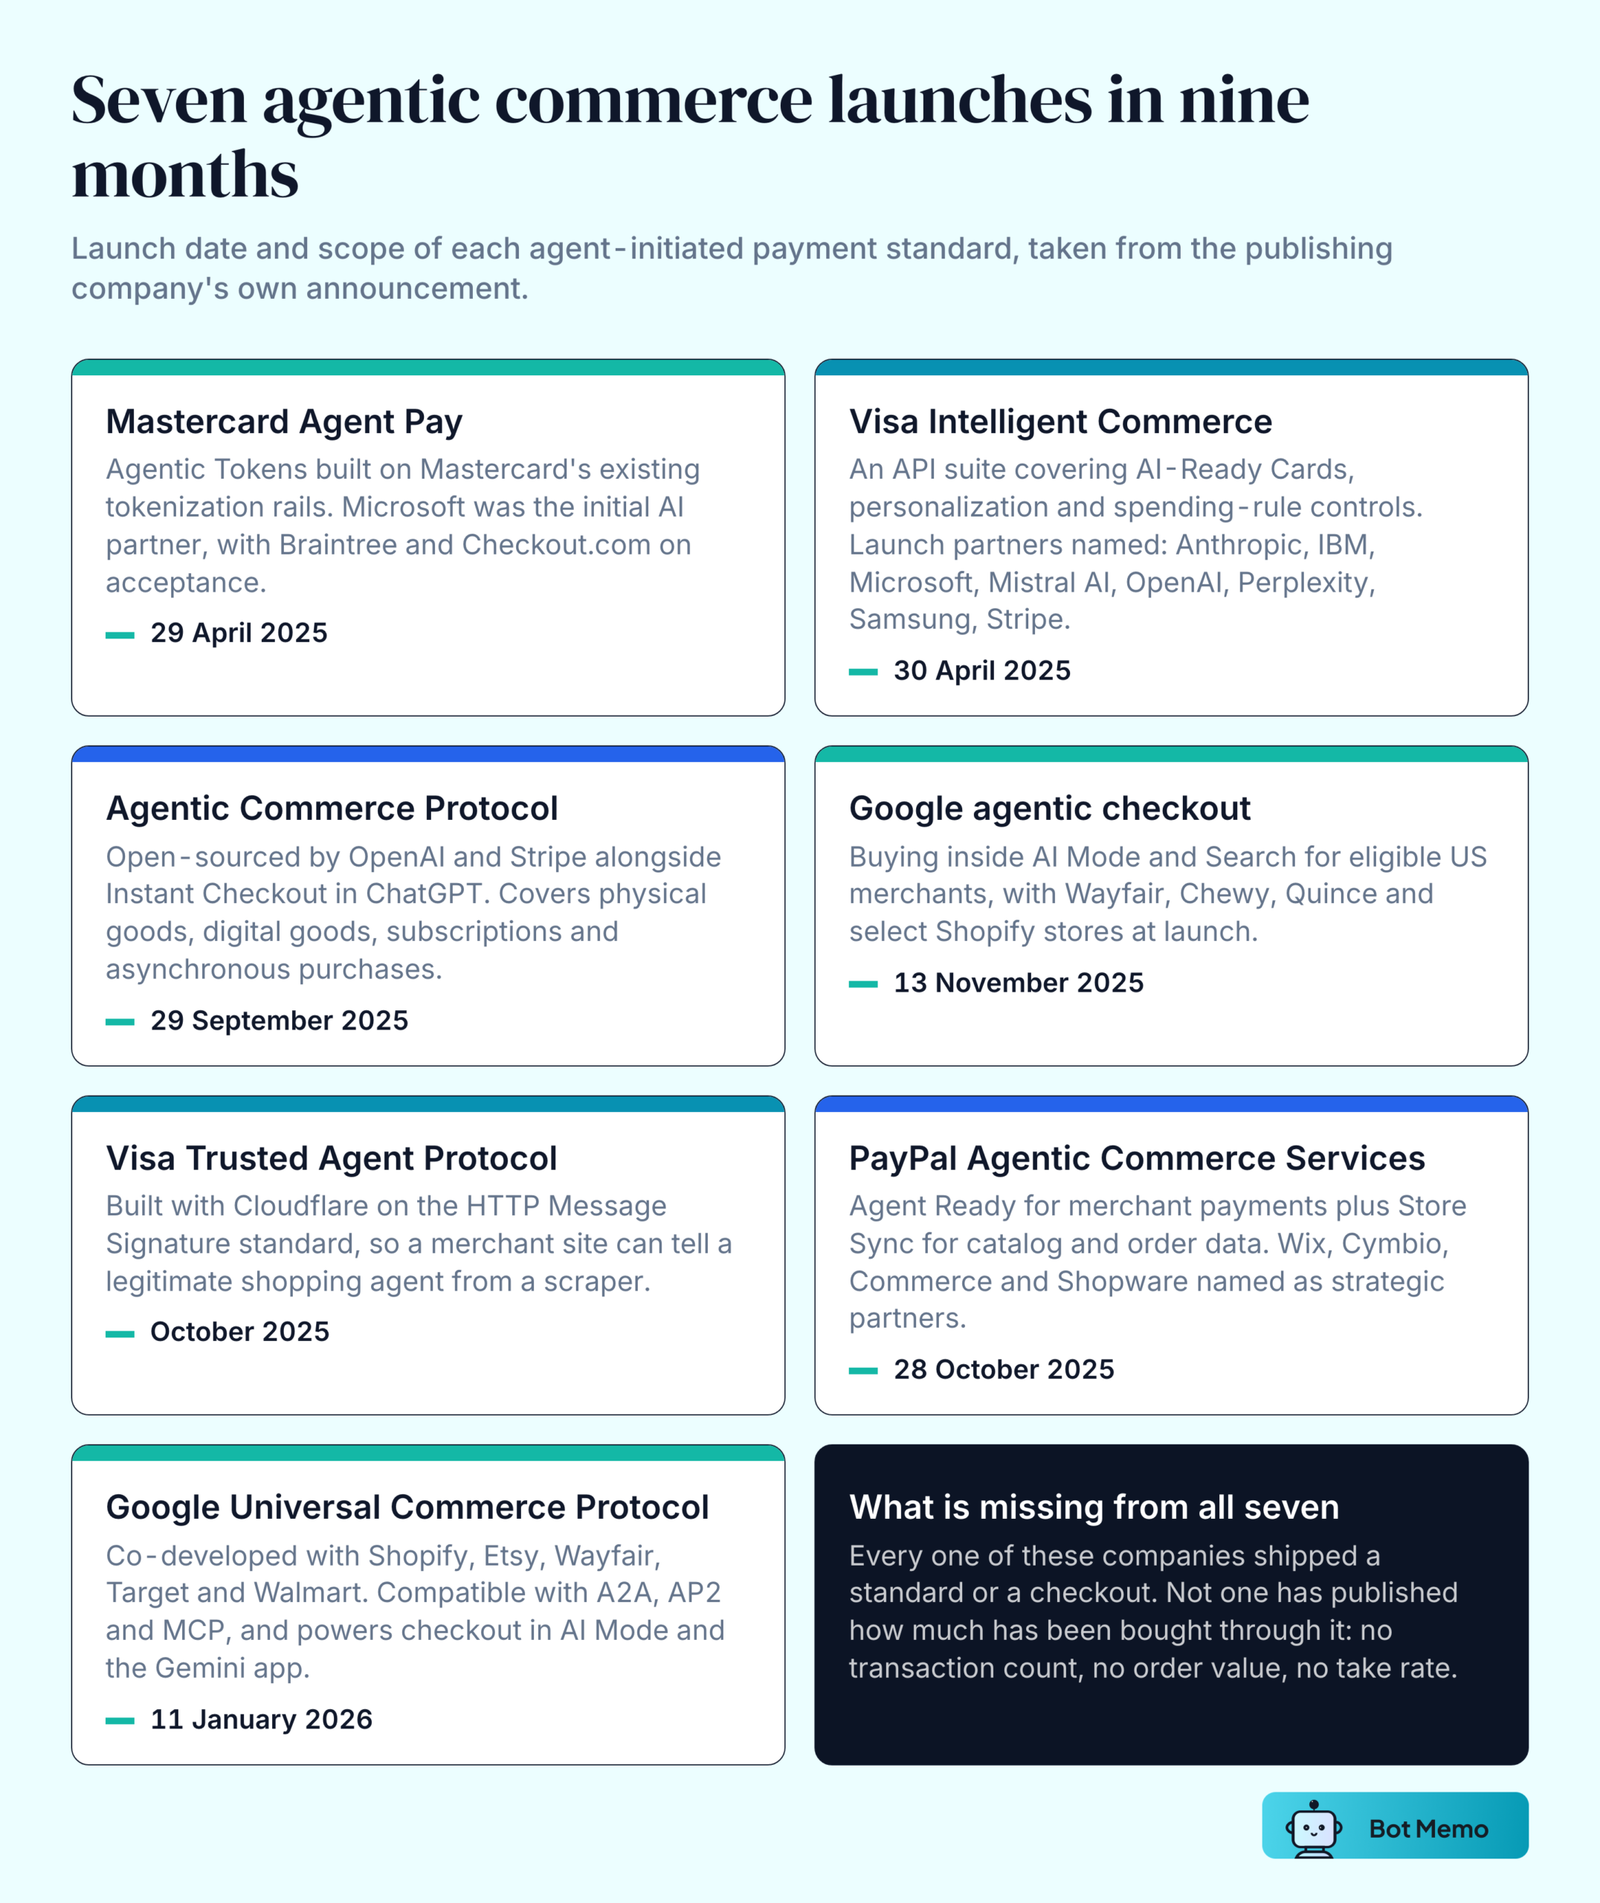
Mastercard opened the sequence on 29 April 2025 with Agent Pay and Agentic Tokens, built on its existing tokenization rails.
-
Visa followed on 30 April 2025 with Visa Intelligent Commerce, naming Anthropic, IBM, Microsoft, Mistral AI, OpenAI, Perplexity, Samsung and Stripe as launch partners.
-
OpenAI and Stripe open-sourced the Agentic Commerce Protocol on 29 September 2025, alongside Instant Checkout in ChatGPT.
-
Visa introduced the Trusted Agent Protocol on 14 October 2025, built with Cloudflare on the HTTP Message Signature standard so a merchant site can tell a shopping agent from a scraper.
-
PayPal launched Agentic Commerce Services on 28 October 2025, with Agent Ready and Store Sync, targeting general availability in early 2026.
-
Google shipped agentic checkout in AI Mode and Search on 13 November 2025, with Wayfair, Chewy, Quince and select Shopify merchants.
-
Google launched the Universal Commerce Protocol on 11 January 2026, co-developed with Shopify and supported by Etsy, Wayfair, Target and Walmart. Google lists it as compatible with the AP2, A2A and MCP agent protocols.
-
Seven agentic commerce products shipped inside nine months, from Mastercard, Visa, OpenAI with Stripe, Google and PayPal. None has disclosed an exact transaction count or total transaction value for its own product.
Instant Checkout And The Pivot
-
OpenAI launched Instant Checkout on 29 September 2025 for US Plus, Pro and Free users, with US Etsy sellers as the first merchant and more than a million Shopify merchants announced as coming soon.
-
OpenAI cited more than 700 million weekly ChatGPT users in the same announcement.
-
On 24 March 2026 OpenAI moved away from running checkout itself. In its own words, the first version of Instant Checkout “did not offer the level of flexibility that we aspire to provide,” so merchants keep their own checkout while ChatGPT focuses on product discovery.
-
Reporting on the pivot said roughly 30 Shopify merchants had completed onboarding, against the million-plus named as coming at launch. Separately, about 200,000 Walmart products were listed.
-
Walmart launched an in-app ChatGPT service the same day, supporting account linking, loyalty and Walmart payments. Shopify announced an Agentic Plan for merchants without a full storefront.
-
Gap said it would launch checkout inside Google’s Gemini, the first large fashion retailer to do so.
-
The first agentic checkout from the largest consumer AI company was rebuilt inside six months, without a single published figure on how much it sold.
What The Card Networks And Wallets Shipped
-
Visa reported working with more than 100 partners globally on Intelligent Commerce as of 18 December 2025, with more than 30 building in its sandbox and more than 20 agents or agent-enablers integrating directly.
-
Mastercard completed live authenticated agentic transactions across Asia-Pacific through 2026, including Australia, New Zealand, Singapore, Malaysia, India, South Korea, Taiwan and Hong Kong.
-
PayPal named Wix, Cymbio, Commerce and Shopware as strategic partners and Perplexity among its distribution partners.
-
Anthropic released open-source commerce-agent blueprints on 2 September 2026, its first move into the commerce stack, with Accenture, Shopify, Visa and Mastercard as early partners. These are developer tools, not a checkout inside Claude.
What Agents Have Actually Transacted
-
Anthropic ran Project Deal in December 2025, giving 69 San Francisco employees $100 each in an AI agent’s account and letting the agents negotiate over Slack with no human in the loop after intake.
-
The agents covered more than 500 listed items and closed 186 deals for a total transaction value of just over $4,000.
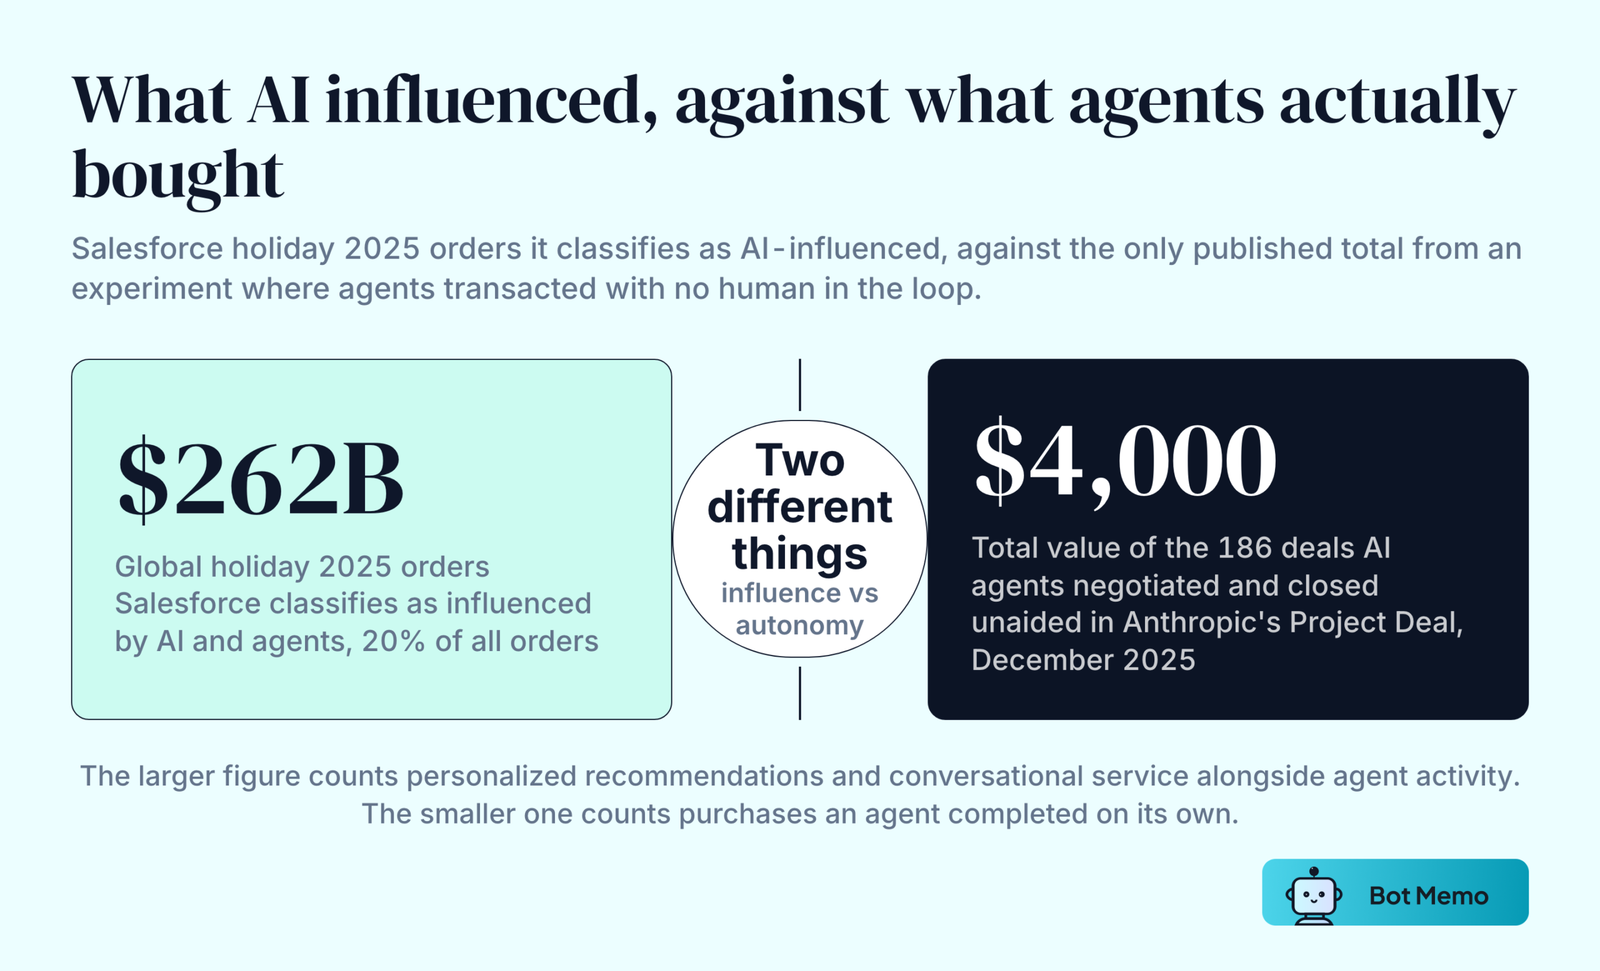
- Project Deal was an internal experiment on a self-selected sample of 69 employees in one city. It remains the only published total for purchases AI agents completed unaided.
Retail AI Adoption Statistics By Platform
Amazon Rufus
-
Amazon put Rufus at 250 million active customers in 2025, disclosed on the Q3 2025 earnings call on 30 October 2025.
-
Amazon put Rufus monthly active users up 140% year over year and interactions up 210%.
-
Customers who engage with Rufus during a shopping trip are 60% more likely to complete a purchase, per Amazon.
-
Amazon said Rufus was on track for more than $10 billion in incremental annualized sales at the Q3 2025 disclosure, then raised that to nearly $12 billion for the year at its Q4 2025 results on 5 February 2026, when it also said more than 300 million customers used Rufus across 2025.
-
“Incremental” is Amazon’s own downstream impact attribution, and the 60% conversion figure comes from customers who chose to open Rufus. Both are first-party measures on a self-selected pool.
Shopify Sidekick And Merchant Tools
-
Shopify reported 750,000 shops using Sidekick for the first time in Q3 2025, on its 4 November 2025 earnings call.
-
Sidekick had accumulated nearly 100 million conversations by that point, including 8 million in October 2025 alone.
-
Shopify’s full-year 2025 revenue was $11.6 billion, up 30% year over year, with Q4 revenue at $3.67 billion, its first quarter above $3 billion.
-
Shopify gross merchandise value, the total sold across its merchants, reached $378 billion in 2025, up 29%, with Q4 GMV at $124 billion, up 31% and its first quarter above $100 billion.
-
Shopify has published adoption figures for Sidekick and nothing on what it is worth. No conversion lift, no merchant revenue impact.
Walmart, Google, eBay, Etsy, And Pinterest
-
Walmart launched Sparky in its mobile app on 6 June 2025, with summarization, recommendation and comparison features.
-
On the Q2 FY2026 earnings call on 21 August 2025, CEO Doug McMillon said Sparky will become the primary vehicle for discovery, shopping and managing everything from reorders to returns.
-
Google put the Shopping Graph at more than 50 billion product listings in January 2026, 2 billion of them refreshed every hour.
-
eBay rolled out a rebuilt Magical Listing in Q4 2025, generating titles, categories, item specifics and pricing guidance from a single photo for new and occasional sellers.
-
Etsy launched Gift Mode on 24 January 2024 with more than 200 AI-generated gift guides, after internal research found only 12% of US shoppers considered Etsy a top gifting destination.
-
Pinterest reported 553 million monthly active users and $1.15 billion in Q4 2024 revenue, its first billion-dollar quarter, with full-year 2024 revenue at $3.64 billion.
Conversational AI And Customer Service At Klarna
-
Klarna’s AI assistant handled 2.3 million conversations in its first month, two-thirds of the company’s customer service chats, per the joint Klarna and OpenAI case study published in February 2024.
-
That was equivalent to the work of 700 full-time agents, across 23 markets and more than 35 languages.
-
Repeat inquiries fell 25% and resolution time dropped from 11 minutes to under 2 minutes.
-
By Q3 2025 the assistant was doing the work of 853 full-time agents with $60 million in cumulative savings.
-
Customer service cost per transaction fell from $0.32 in Q1 2023 to $0.19 in Q1 2025, a 40% reduction over two years.
-
Klarna reintroduced human agents in May 2025 after its CEO said customers should always have a human option. The satisfaction claims in the original case study were disputed by analysts.
Social Commerce And AI Shopping Startup Funding
TikTok Shop And US Social Commerce
-
TikTok Shop US sales reached $15.82 billion in 2025, up 108.0% year over year, after 407.0% growth in 2024, per EMARKETER.
-
That gave TikTok Shop 18.2% of total US social commerce in 2025, projected to reach 24.1% by 2027.
-
Total US social commerce sales were $87.02 billion in 2025, up 21.5%, and are forecast to pass $100 billion in 2026.
-
ByteDance does not disclose TikTok Shop GMV. Momentum Works puts US 2025 GMV at $15.1 billion, up 68% on 2024, against EMARKETER’s $15.82 billion. Two third-party estimates, one definitional gap.
Where AI Retail Startup Funding Went
-
Bot Memo’s dataset holds 760 funded AI startups in the retail and e-commerce segment between January 2023 and August 2026.
-
Those companies raised $19.84 billion in disclosed funding across the period.
-
Through the first eight months of 2026, AI retail and e-commerce startups closed 230 rounds worth $7.37 billion, against 130 rounds worth $2.35 billion over the same months of 2025.
-
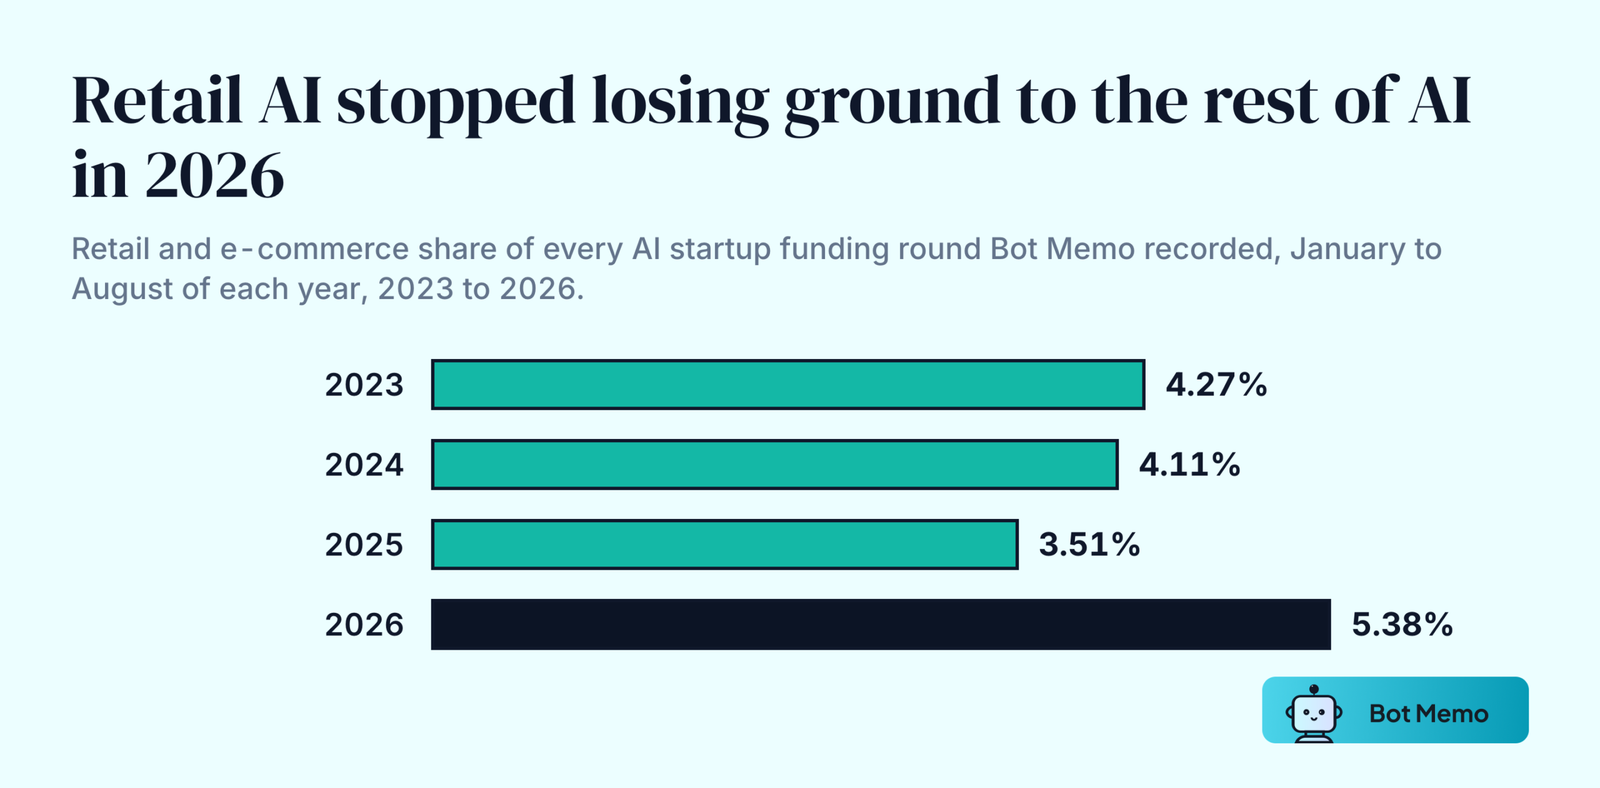
As a share of all AI deals, the segment slipped in each of the next two years, from 4.27% of rounds in the first eight months of 2023 to 4.11% in 2024 and 3.51% in 2025, then jumped to 5.38% in 2026.
-
The 2026 cohort is early stage. Seed and Series A account for 123 of the 230 rounds, with a further 20 at pre-seed.
-
The United States leads on deal count with 67 rounds in 2026, followed by India with 61 and the United Kingdom with 19.
-
The three largest disclosed rounds in the period all closed in 2026. Wonder raised $650 million in July, Whatnot $545 million in August and Quince $500 million in March.
Key Takeaways
- The market-size figures that dominate search results for this topic do not survive a check against a primary source. Use the Census Bureau for e-commerce size and Adobe or Salesforce for AI’s measured effect on it.
- US e-commerce growth accelerated sharply. Q2 2026 was up 12.2% year over year against 5.0% a year earlier, and online is now 17.1% of all US retail.
- AI referral traffic is still growing fast, and the growth rate has come down sharply since Adobe’s July 2025 reading. The 4,700% reading from July 2025 became 269% by March 2026, against different comparison windows.
- The conversion story flipped. AI traffic went from converting 49% worse than other traffic in January 2025 to 42% better in March 2026.
- Seven agentic commerce products shipped in nine months, from Mastercard, Visa, OpenAI with Stripe, Google and PayPal. None has disclosed an exact transaction count or total transaction value, and OpenAI rebuilt its version within six months.
- The largest verifiable number from a company running AI commerce is Amazon’s nearly $12 billion in Rufus-attributed incremental 2025 sales, measured with Amazon’s own attribution model.
- Willingness collapses at the point of delegation. Around 39% to 47% of shoppers use AI somewhere in the process, 24% are comfortable with an agent buying for them, and about half are explicitly cautious about it.
Frequently Asked Questions
How Is AI Used In Ecommerce?
AI adoption in ecommerce clusters in four places: product discovery and search, product recommendations, conversational AI for customer service, and, since 2025, agent-initiated checkout. Adobe’s survey puts research at 53% of consumer AI shopping use, recommendations at 40% and deal-seeking at 36%. On the retailer side, Klarna’s assistant handles the work of 853 full-time service agents and Amazon’s Rufus reached 250 million active customers.
What Is Retail AI Adoption Running At?
No one has published a defensible number for AI adoption across all ecommerce businesses. Salesforce’s survey of 1,700 retail decision-makers found 84% using some form of AI and 43% piloting autonomous agents. The widely-quoted “96% of online retailers” figure does not resolve to a survey with a published sample and method, so treat it as unsourced.
Do AI Shoppers Actually Convert?
They do now. Adobe measured AI-sourced traffic converting 49% worse than other traffic in January 2025, 23% worse by July 2025, 31% better over the 2025 holiday season and 42% better in March 2026. Adobe attributes the shift to AI referrals arriving later in the purchase decision. The classification depends on Adobe’s own list of AI referring domains, which it has not published.
How Much Has Agentic Commerce Actually Sold?
No operator has given an exact figure. OpenAI published none at all for Instant Checkout across its entire life, from launch in September 2025 to redesign in March 2026. Visa described “hundreds” of agent-initiated transactions. Mastercard, PayPal and Google disclosed none. Salesforce’s $262 billion of AI-influenced holiday orders counts recommendations and conversational service, not completed agentic checkouts.
Are Shoppers Comfortable Letting AI Buy For Them?
Mostly not yet. Salesforce found 24% of consumers comfortable with AI agents shopping for them, rising to 32% among Gen Z. Bain found about half of US consumers cautious about fully autonomous purchases. Willingness rises sharply for bounded tasks: 70% would let an agent optimise loyalty points and 66% would let one buy when a price drops.
Which Companies Have Disclosed Real AI Commerce Numbers?
Amazon, Shopify and Klarna. Amazon disclosed more than 300 million customers using Rufus across 2025 and nearly $12 billion in attributed incremental sales, both at its Q4 2025 results. Shopify reported 750,000 shops using Sidekick and nearly 100 million conversations. Klarna reported 853 full-time-agent equivalents and cost per transaction falling from $0.32 to $0.19. All three are first-party measures.
How Big Is US Ecommerce Overall?
US retail e-commerce sales were $340.2 billion in the second quarter of 2026, seasonally adjusted, equal to 17.1% of total US retail sales, per the Census Bureau’s Quarterly Retail E-Commerce Sales release of 18 August 2026.
Is AI Taking Over Ecommerce?
Not on the evidence available. Generative AI tools influence a large and growing share of discovery and service, and Salesforce puts AI-influenced orders at 20% of the global total. Autonomous purchasing is a different question, and the only published total for what agents have bought unaided is just over $4,000 from a 69-person experiment.
Sources And Methodology
Figures come from the organisation that produced them: US Census Bureau quarterly releases, company earnings calls and investor releases (Amazon, Shopify, Klarna, Pinterest, eBay, PayPal, Visa, Mastercard), company product announcements (OpenAI, Stripe, Google, Walmart, Perplexity, Anthropic, Etsy), and named research programmes (Adobe Analytics and its companion consumer surveys, Salesforce Connected Shoppers and State of Marketing, Bain & Company, Capgemini Research Institute, EMARKETER, Momentum Works).
Census figures are taken from the Quarterly Retail E-Commerce Sales release of 18 August 2026, which carries revised estimates for earlier quarters. Where a quarter has been revised, the revised figure is the one used here.
Vendor-produced figures are named as such in the body. Adobe sells analytics software and measures a population skewed toward large retailers running its product. Salesforce sells the Agentforce platform whose influence it measures. Visa, Mastercard and PayPal each measure a market they sell into. Their numbers appear here with the organisation attached so the interest is visible.
Four categories of widely-circulated figure were excluded for lack of a traceable primary source: the “$8.65 billion AI in e-commerce market” and its forecast variants, the “369% average order value lift,” the “AI personalization lifts conversion by up to 10%” figure, and the “$100 billion voice commerce by 2026” forecast. Where an aggregate market-sizing number was needed, the Census Bureau’s e-commerce series is used instead.
Funding figures for AI retail and e-commerce startups come from Bot Memo’s own dataset of AI startup funding rounds, covering January 2023 to August 2026. Amounts raised in other currencies are converted to US dollars. Companies serving more than one segment are counted in each, so segment counts sum above the dataset total. Rounds without a disclosed amount are counted in deal totals and excluded from dollar totals.
Related Bot Memo analysis: AI agent startups and their funding, the AI agent market map, AI browser statistics, AI marketing statistics, chatbot statistics and AI customer experience statistics.

About the author
Editorial Staff
The Editorial Staff at Bot Memo is a team of writers, analysts, and AI agents dedicated to mapping the global AI startup ecosystem. Led by Chintan Zalani, the team tracks thousands of funding rounds, classifies companies across verticals, and distills it all into actionable intelligence for investors and founders.