
Half of American adults now talk to an AI chatbot, and only 3% of customer service interactions were handled by AI in 2023, the year the forecasts everyone still quotes were written. Both numbers are true, and the gap between them explains most of what happened to this market. This page collects the chatbot statistics that hold up in 2026, each traced to the report, survey or filing it came from: Pew Research Center, Gartner, Salesforce, Zendesk, Consumer Reports, Grand View Research, and the vendors’ own platform data. Where a 2023 or 2024 benchmark has been overtaken, the old number stays next to the new one.
On this page
Key Chatbot Statistics for 2026
The Headline Numbers
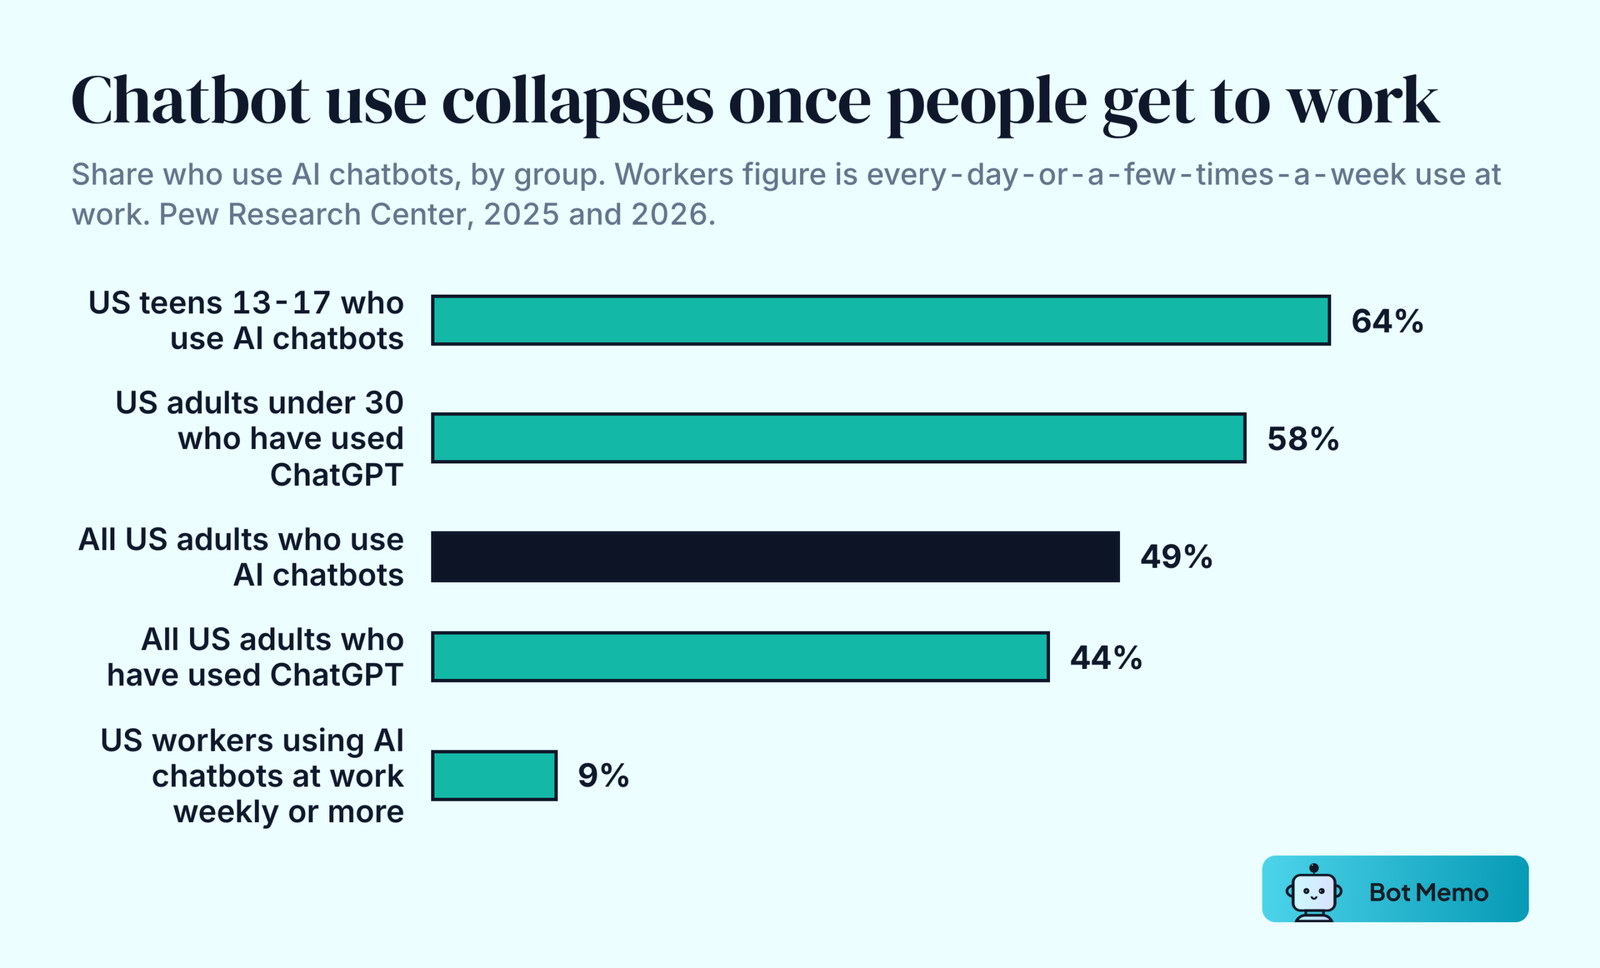
1. 49% of US adults say they use AI chatbots, up from 33% in 2024, according to a Pew Research Center survey of 5,119 adults fielded in February 2026.
2. 44% of US adults have used ChatGPT, up from 34% a year earlier and 18% in 2023. (Pew Research Center)
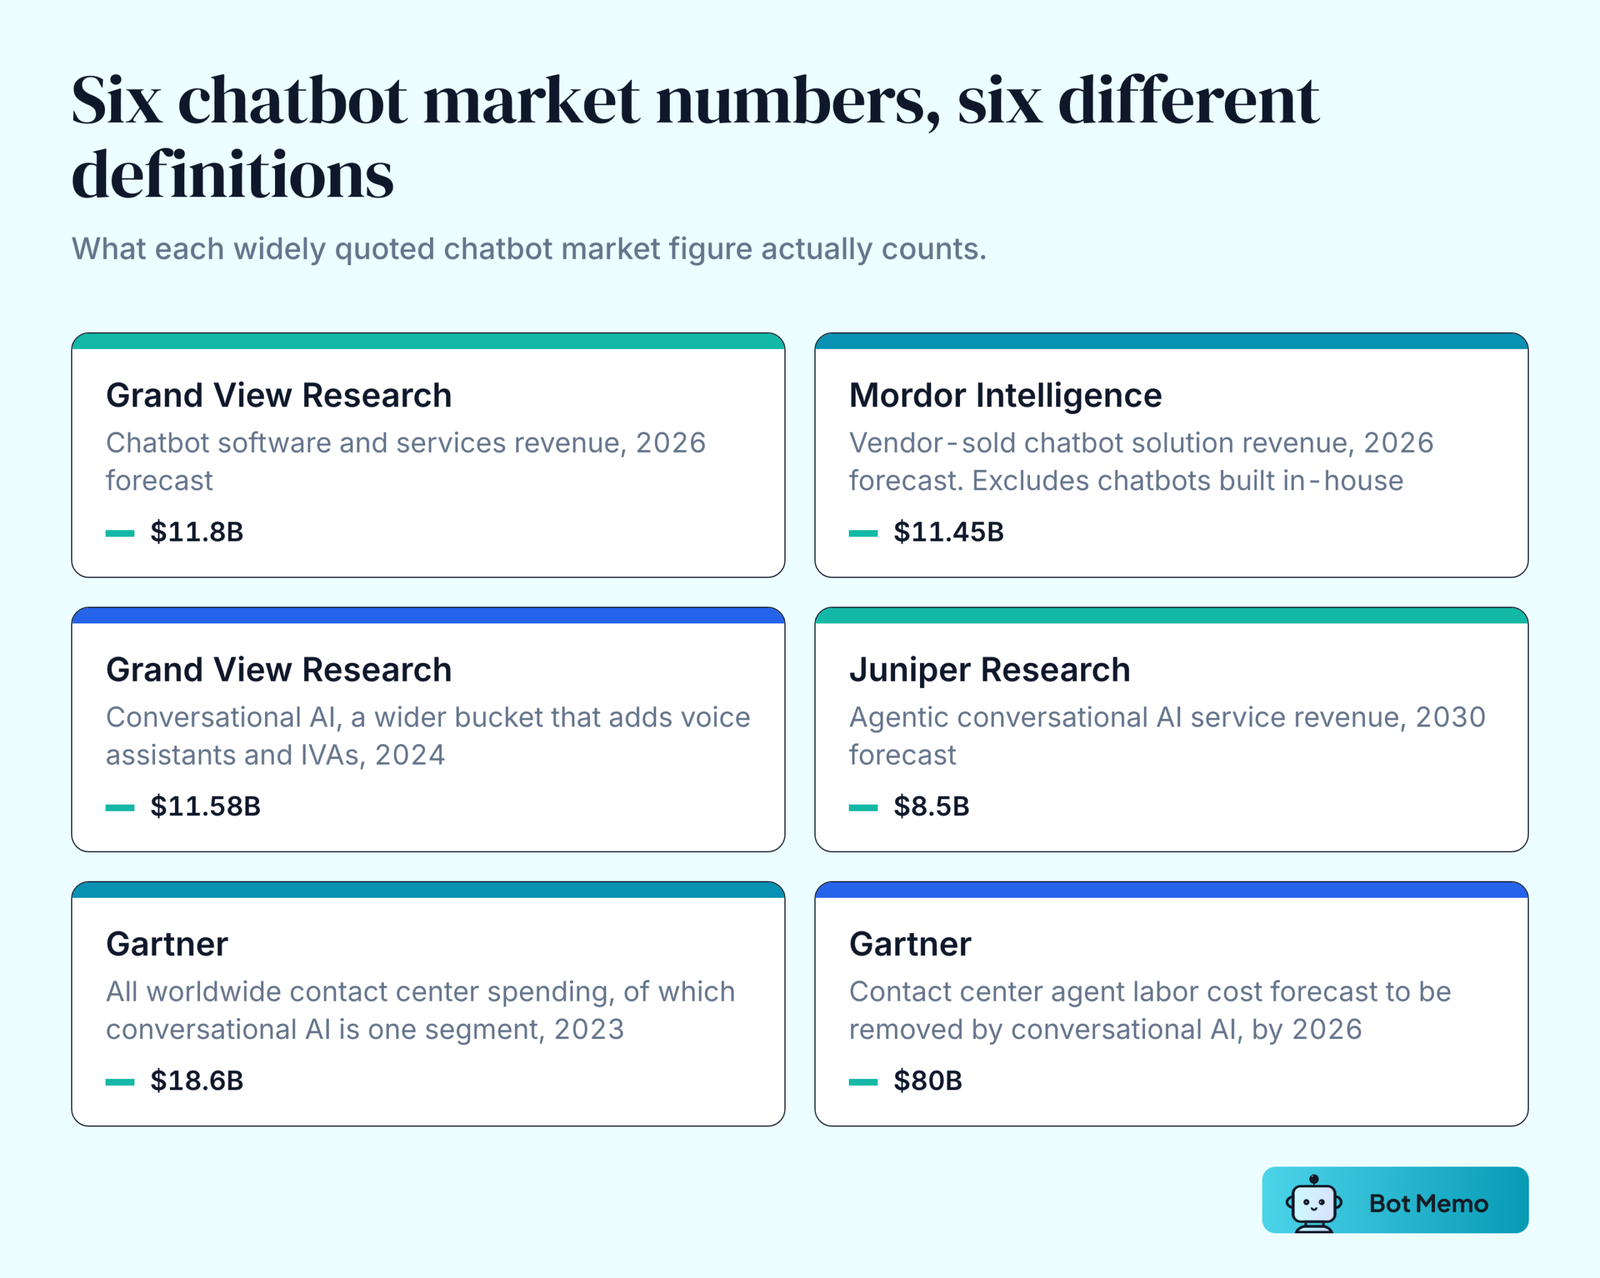
3. The global chatbot market is forecast at $11.8 billion in 2026, reaching $41.2 billion by 2033 at a 19.6% compound annual growth rate, per Grand View Research.
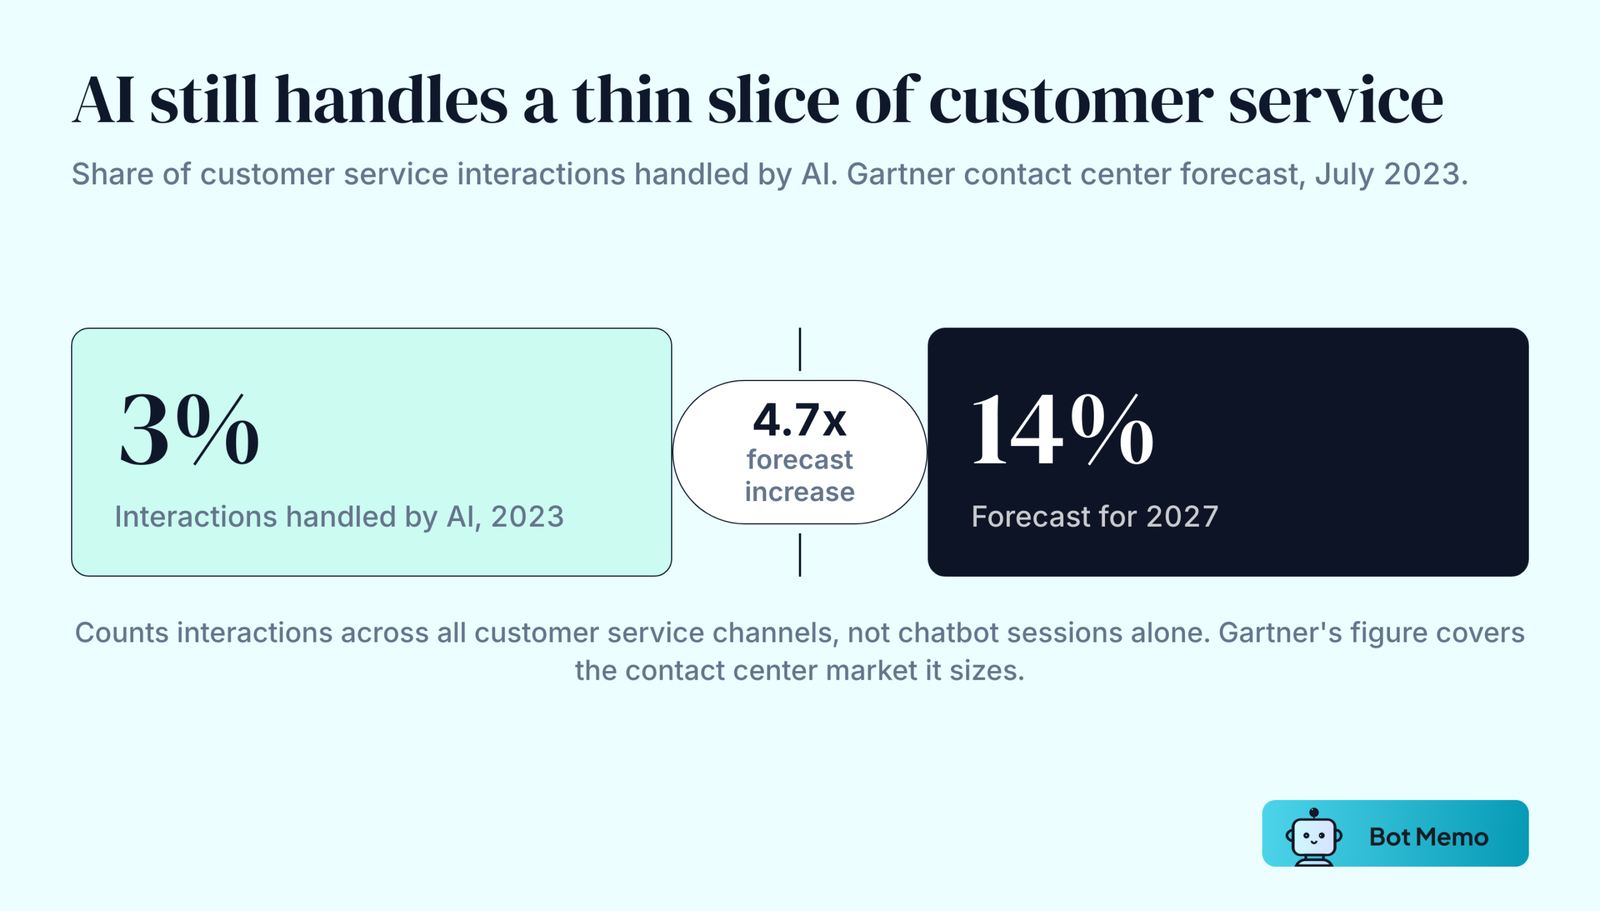
4. Only 3% of customer service interactions were handled by AI in 2023, and Gartner forecast that reaching 14% by 2027.
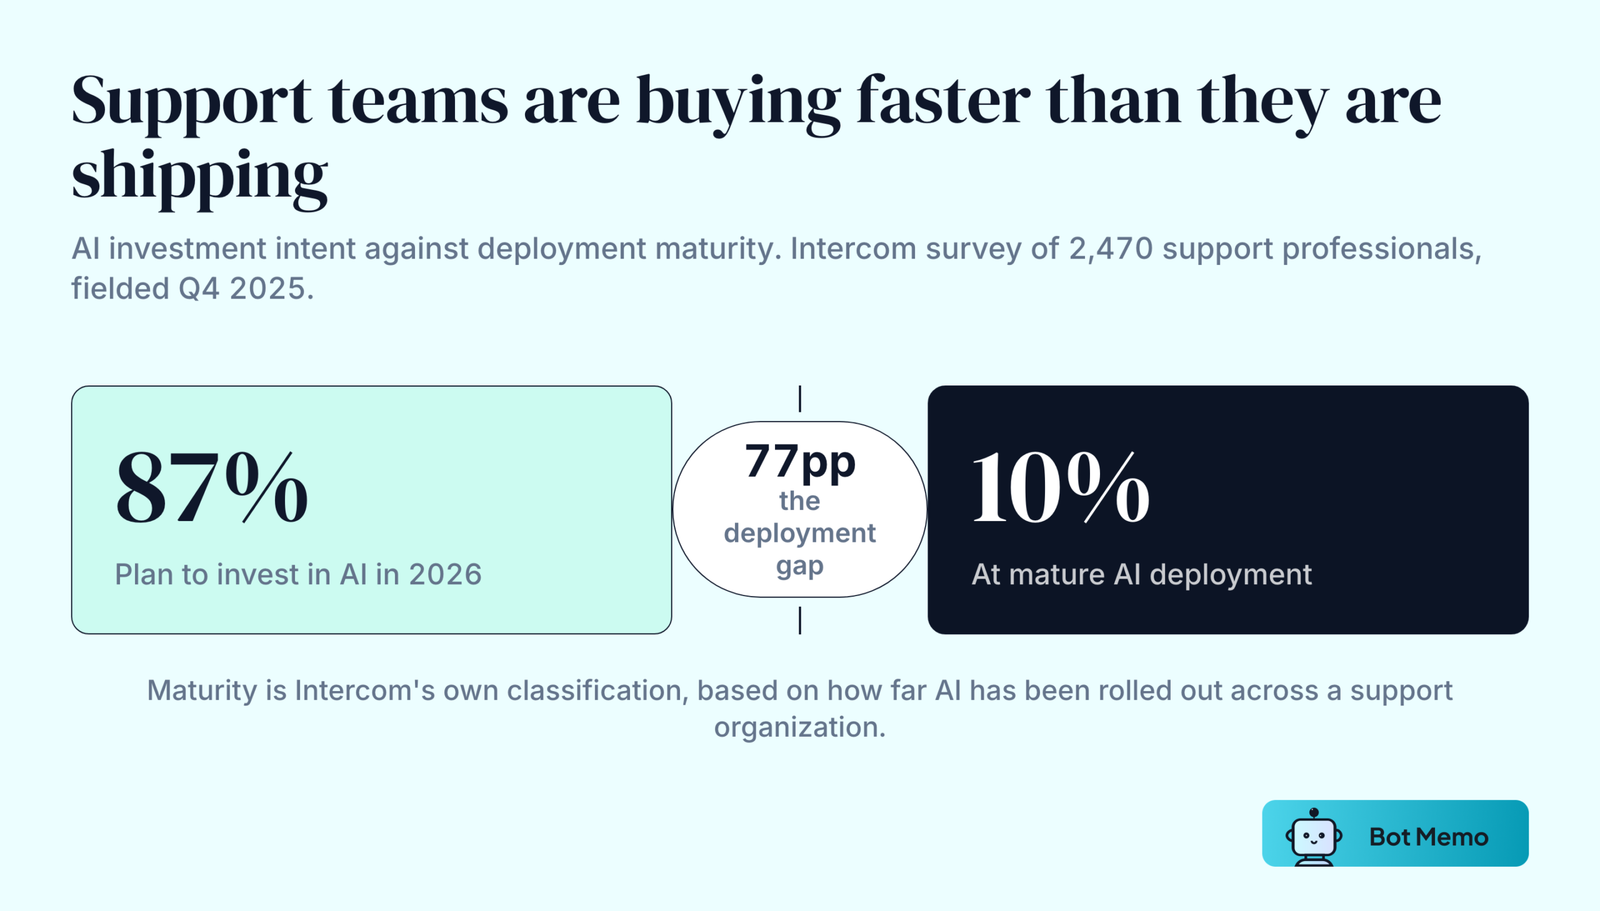
5. 87% of support teams plan to invest in AI during 2026, while 10% have reached what Intercom classifies as mature AI deployment, from a survey of 2,470 support professionals.
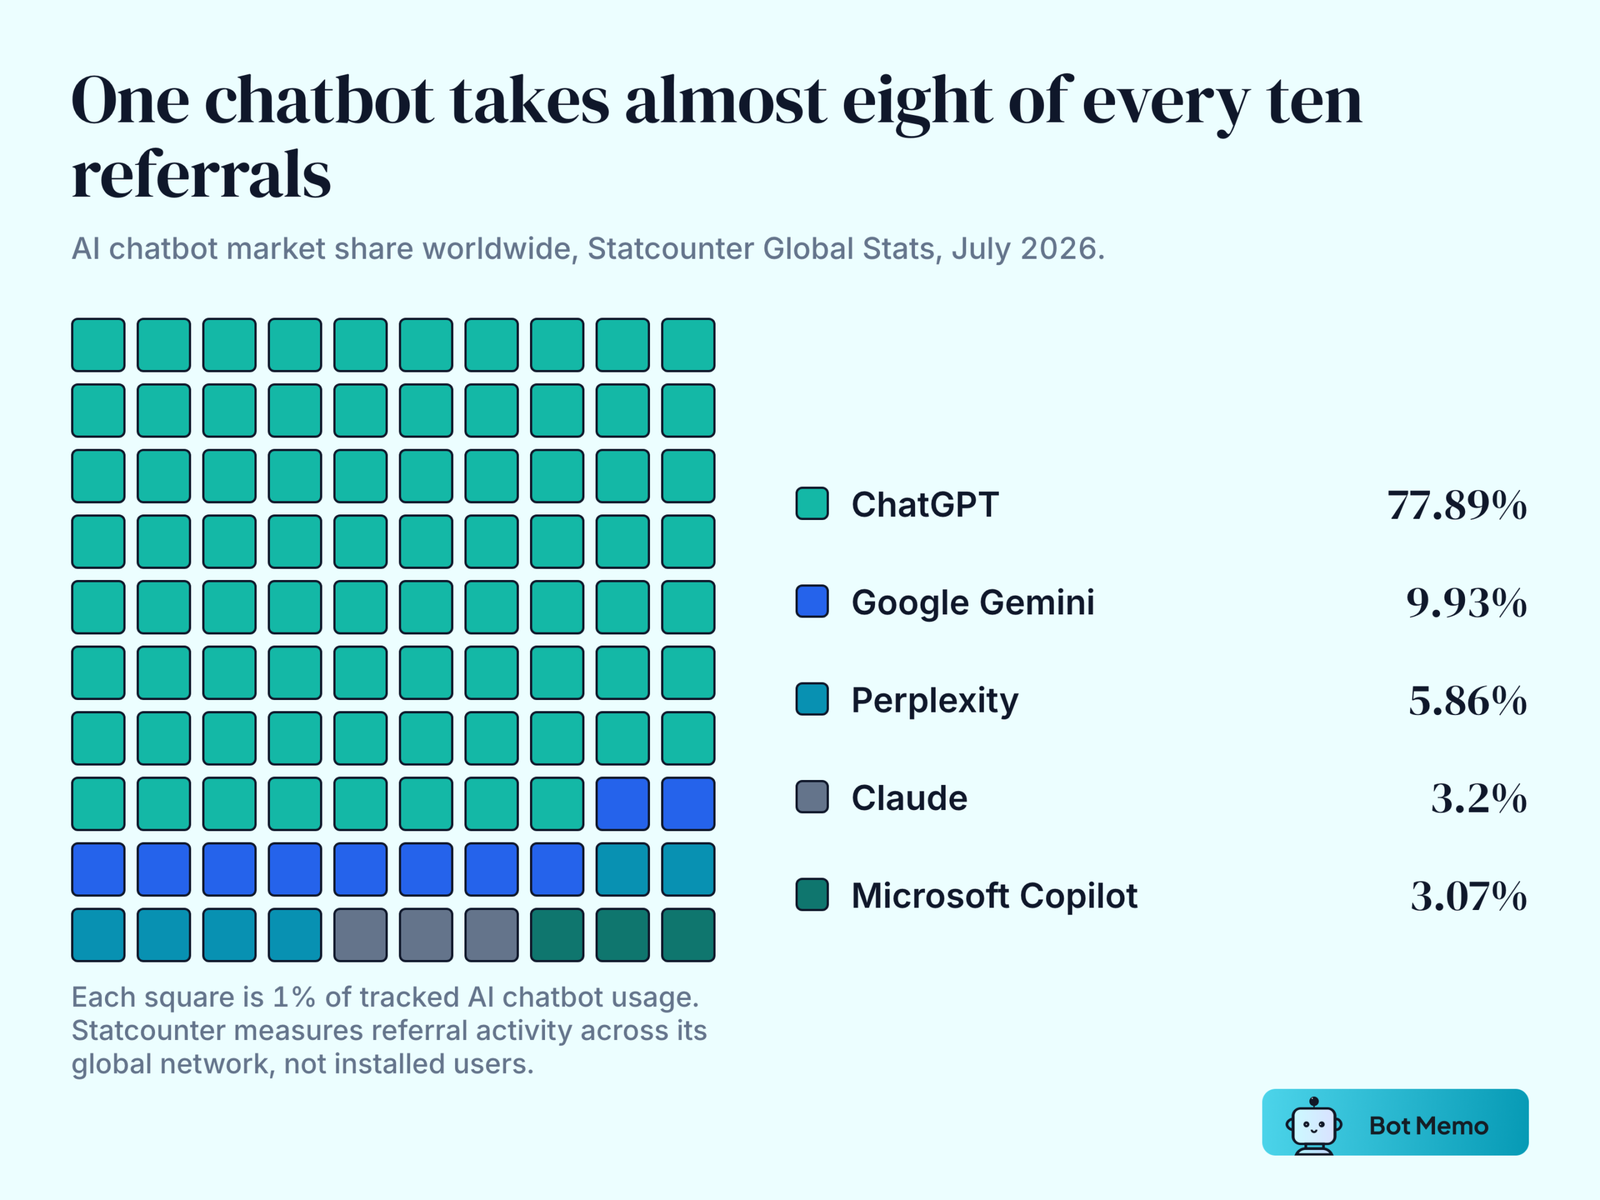
6. ChatGPT accounted for 77.89% of tracked AI chatbot activity worldwide in July 2026, per Statcounter Global Stats.
7. 82% of service professionals agree customer expectations are higher than they used to be, from Salesforce‘s survey of 6,500 service professionals across 40 countries, fielded April to June 2025.
What Changed Since the 2025 Edition
8. Grand View Research previously put the chatbot market at $5,132.8 million in 2022, growing at a 23.3% CAGR to $27.3 billion by 2030. The current edition rebases to $9.6 billion in 2025 and runs a slower 19.6% CAGR out to 2033.
9. Juniper Research forecast $11 billion in annual chatbot cost savings by 2023 in a press release dated July 3, 2018. Its current work is filed under conversational AI, and projects agentic conversational AI service revenue tripling to $8.5 billion by 2030.
10. Tidio’s earlier survey put daily business chatbot use at 10%. Its current edition measures shoppers instead, and reports 27% using chatbots daily with 34% using them a few times a week.
11. Stanford HAI‘s AI Index recorded 78% of organizations using AI in 2024. The 2026 edition puts it at 88% for 2025, with 70% using generative AI in at least one business function.
Chatbot Market Size Statistics
Global Chatbot Market Size
12. Grand View Research estimated the chatbot market at $9.6 billion in 2025, the base year behind its 2026 forecast.
13. Solutions accounted for 61.8% of chatbot market revenue in 2025, and North America held 31.3%. (Grand View Research)
14. Mordor Intelligence sizes the same market at $9.30 billion in 2025 and $11.45 billion in 2026, reaching $32.45 billion by 2031 at a 23.15% CAGR.
15. Mordor puts North America at 38.72% of the chatbot market in 2025, with customer support applications taking 41.82%.
16. Mordor’s figure counts only vendor-sold solution revenue, so chatbots built in-house sit outside it.
Conversational AI Market Size
17. The wider conversational AI market, which adds voice assistants and intelligent virtual agents, was worth $11.58 billion in 2024 and is forecast at $41.39 billion by 2030 at a 23.7% CAGR. (Grand View Research)
18. Juniper Research projects agentic conversational AI service revenue tripling to $8.5 billion globally by 2030.
19. Juniper’s February 2025 edition put global conversational AI services revenue at $14.6 billion in 2025, rising above $23 billion by 2027.
Contact Center Spending Statistics
20. Worldwide contact center spending reached $18.6 billion in 2023, up 16.2% year over year. (Gartner)
21. Conversational AI was the fastest-growing contact center segment, at 24% growth in 2024. (Gartner)
22. Gartner forecast conversational AI cutting $80 billion from contact center agent labor costs by 2026, with one in ten agent interactions automated by then, against about 1.6% in 2022.
Chatbot Adoption Statistics
How Many Businesses Use Chatbots
23. Tidio‘s earlier survey found 16% of businesses already using a chatbot, a figure the current edition of that page no longer carries.
24. In the same earlier Tidio survey, 28% of businesses did not want a chatbot at all, while 55% planned to add one at some point.
25. 10% of consumers said they were using chatbots at the time of Vonage‘s 2024 survey, and 23% expected to be using them within six to twelve months, from nearly 7,000 responses across 17 countries.
26. Service operations staff and leaders who use AI agents expect service costs and case resolution times to fall by an average of 20%. (Salesforce)
Enterprise AI Adoption Statistics
27. 42% of enterprise-scale organizations with 1,000 or more employees have AI actively deployed, another 40% are exploring it, and 38% are actively implementing generative AI, from IBM‘s Global AI Adoption Index, a Morning Consult survey of 8,584 IT professionals across 15 countries with a margin of error of one percentage point.
28. India led enterprise AI deployment at 59%, followed by the UAE at 58% and Singapore at 53%. (IBM)
29. 88% of organizations regularly use AI, up from 78% the previous year, and 39% report any EBIT impact at enterprise level, per a McKinsey Global Survey of 1,993 respondents across 105 countries fielded June to July 2025.
30. 25% of leaders have moved more than 40% of their AI experiments into production, 21% have a mature governance model for autonomous agents, and 34% are applying AI to transform the business itself, from Deloitte‘s survey of 3,235 leaders across 24 countries, fielded August to September 2025.
31. About 33% of customer experience budgets are going to AI technologies, per Genesys, which surveyed 5,232 consumers and 1,181 CX decision makers across 16 countries.
Which Industries Use Chatbots the Most
32. Real estate ranked as the top chatbot industry at 28%, ahead of travel at 16% and education at 14%, in Chatbots Life‘s 2019 industry report.
33. Customer support remains the single largest chatbot application by revenue, at 41.82% of the market. (Mordor Intelligence)
34. Retail and e-commerce is the dominant vertical in Grand View Research’s chatbot segmentation.
Chatbot Adoption at Work
35. 55% of US workers rarely or never use AI chatbots at work, and only 9% use them every day or a few times a week, from a Pew Research Center survey of 5,273 employed adults fielded in October 2024.
36. 77% of CRM leaders use AI, per HubSpot‘s survey of 1,537 customer experience leaders in March 2024.
37. 76% of customer service teams invested in AI during 2024, against the 54% who had said they planned to, per Intercom‘s survey of more than 2,000 support professionals.
38. 81% of support professionals agree AI is changing the economics of customer service, and 89% believe customer attitudes toward AI shifted within twelve months. (Intercom)
Chatbot Usage Statistics
How Many People Use AI Chatbots
39. 64% of US teens use AI chatbots, and about three in ten use one daily, from a Pew Research Center survey of 1,458 teens aged 13 to 17 fielded in autumn 2025.
40. 58% of US adults under 30 had used ChatGPT as of June 2025. (Pew Research Center)
41. About 24% of US adults use AI chatbots daily, including 12% who use them several times a day and 4% who use them almost constantly. (Pew Research Center)
42. In August 2023, a third of Americans said they had used an AI chatbot in the past three months: 19% had used ChatGPT, 6% Bing AI and 4% Bard, per Consumer Reports and NORC AmeriSpeak, from 2,062 respondents with a margin of error of 2.64 percentage points.
What People Ask Chatbots to Do
43. Among Americans who had used an AI chatbot in the past three months, 35% used it instead of a search engine and 35% used it to have something explained. (Consumer Reports)
44. 23% of those chatbot users used one to write, rewrite or edit something to accomplish a task, and 14% did so for an artistic or entertainment purpose. (Consumer Reports)
45. 37% of chatbot users said they used one because they thought it would be fun, 36% because it would save time and 35% because it would make a task easier or less stressful. (Consumer Reports)
46. 21% of Americans had used a chatbot for a health-related topic in the previous six months, from Consumer Reports’ November 2023 wave of 2,070 respondents.
47. Microsoft analyzed 37.5 million de-identified Copilot conversations between January and September 2025 to map what people actually do with an assistant.
When People Talk to Chatbots
48. 39% of conversations happened outside normal business hours across Drift’s East Coast customer base, per the Conversation Trends Report published by Drift, a Salesloft company.
49. 41% of all meetings booked through Drift happened outside nine to five. (Drift)
50. When both options were offered, 53% of visitors chose a button response and 47% typed open text. (Drift)
51. Drift’s report draws on more than 30 million conversations across its instances during 2023, which makes it platform telemetry rather than a survey.
Chatbot Market Share Statistics
52. Behind ChatGPT in July 2026, Google Gemini held 9.93% of tracked AI chatbot activity, Perplexity 5.86%, Claude 3.2% and Microsoft Copilot 3.07%. (Statcounter Global Stats)
53. LivePerson powers nearly one billion conversational interactions each month. Its fourth-quarter 2024 revenue was $73.2 million, down 23.3% year over year.
54. Facebook’s bot platform passed 300,000 bots, and Messenger carried 8 billion messages a day, per VentureBeat‘s May 2018 report. Meta has published no updated count since.
55. ChatGPT’s mobile app took a record $4.58 million in gross revenue in September 2023 on 15.6 million downloads, and was still out-earned that month by the rival chatbot app Ask AI at $5.51 million, from Appfigures data reported by TechCrunch.
Chatbot ROI and Cost Savings Statistics
The Cost Savings Forecasts
56. Chatbot adoption across retail, banking and healthcare would deliver $11 billion in annual business cost savings by 2023, up from an estimated $6 billion in 2018, per a Juniper Research press release dated July 3, 2018. The same forecast projected more than 2.5 billion customer service hours saved and $112 billion in chatbot-driven e-commerce transactions by 2023.
57. The cost of an automated interaction is generally about a tenth of the cost of a conversation with an agent, per Forrester‘s Conversational AI Wave.
What Companies Report After Deployment
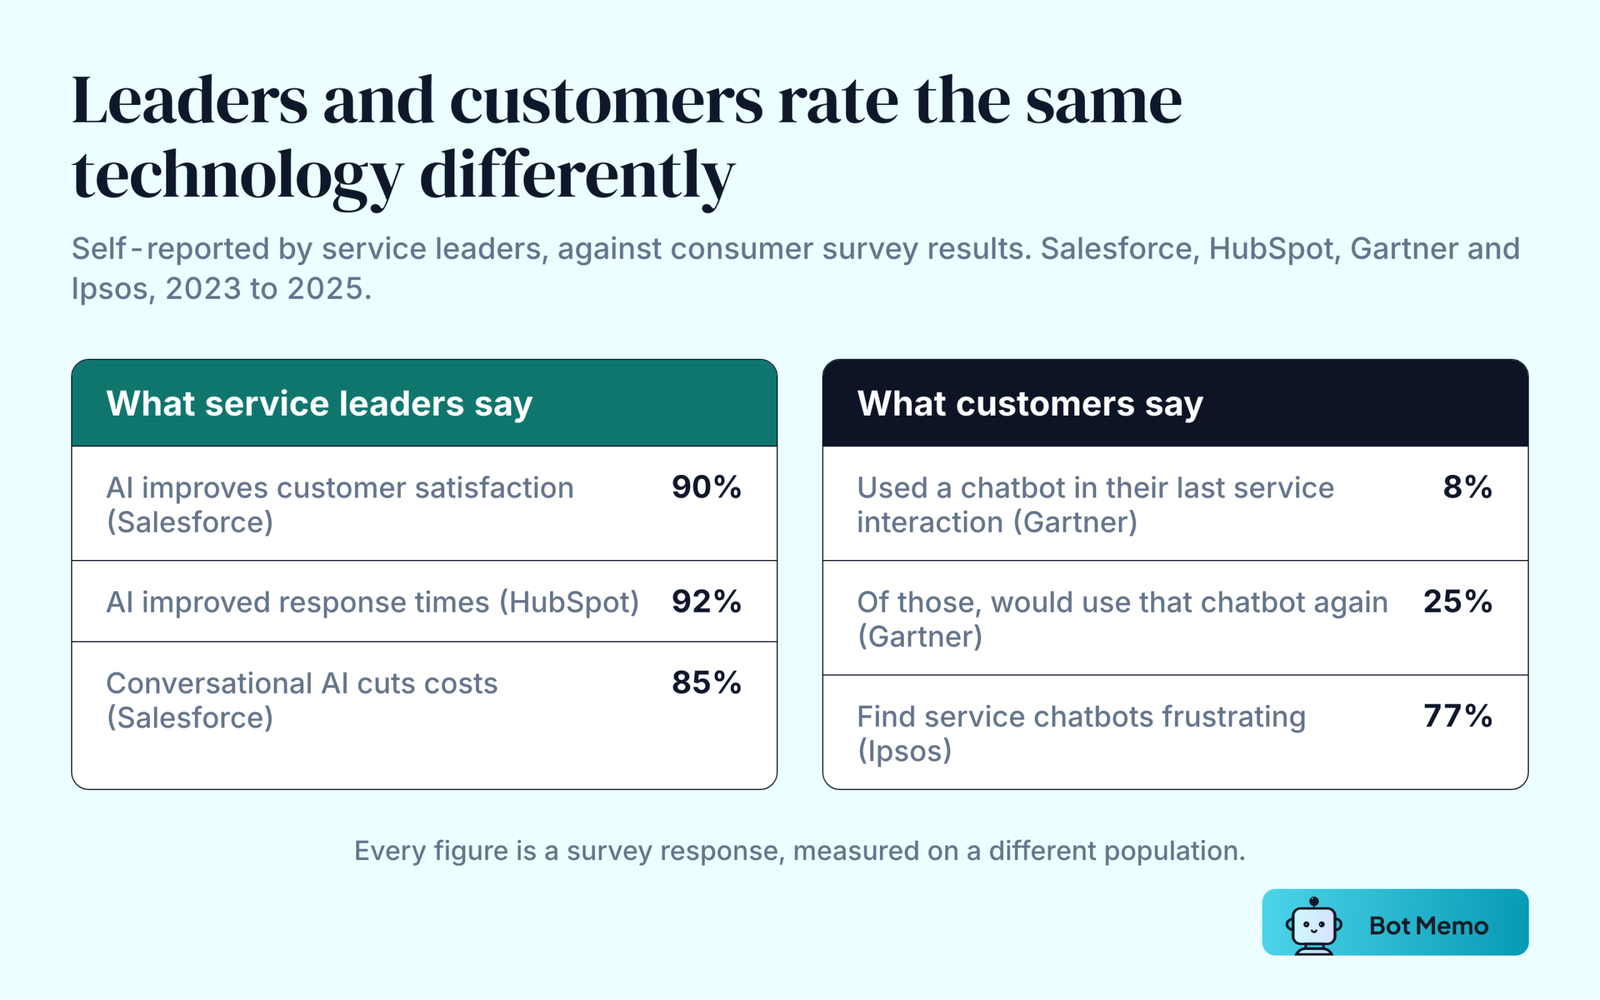
58. 90% of service leaders with AI say it improves customer satisfaction, and 90% say it helps them make faster and better-informed decisions. (Salesforce)
59. Service professionals credit conversational AI with increasing self-service resolution (89%), accelerating resolution times (88%), enhancing accessibility for diverse customer groups (88%), freeing representatives for complex issues (87%) and cutting costs (85%). (Salesforce)
60. 92% of CRM leaders say AI improved their customer service response times, 86% of those using AI say it positively affected CSAT, and 65% say AI is more effective for scaling service operations than hiring more representatives. (HubSpot)
61. 77% of CRM leaders believed AI would handle most ticket resolutions by 2025. (HubSpot)
62. Mature AI adopters report 17% higher customer satisfaction and 38% lower average inbound call handling time, and 71% of executives aim to fully automate customer support inquiries by 2027, per the IBM Institute for Business Value.
63. Generative AI could raise customer care productivity by the equivalent of 30% to 45% of current function costs, and cut human-serviced contacts by up to half in banking, telecom and utilities, per McKinsey‘s analysis of 63 use cases across 16 business functions.
64. One 5,000-agent company in McKinsey’s study resolved 14% more issues per hour and cut agent attrition by 25% after deploying generative AI.
65. Freshworks’ Freddy AI passed $25 million in annual recurring revenue during the fourth quarter of 2025, with more than 8,000 customers and AI attach rates above 50% among customers spending over $30,000 a year.
Where the Savings Come From
66. Agents who waited five minutes to respond increased the risk of site visitors leaving by 10 times. (Drift)
67. Agents who waited ten minutes raised that risk by 100 times. (Drift)
68. Requests to speak to a human increased 2.5 times between 2022 and 2023. (Drift)
69. 82% of users would rather use a chatbot than wait for a human agent. (Tidio)
70. Businesses adopting chatbots cited automating customer service tasks (17%), fatigue with answering the same questions repeatedly (14%) and cost reduction (11%) as their reasons. (Tidio)
71. Round-the-clock availability drove 19% of chatbot adoption in Tidio’s earlier survey. The current edition puts getting help 24/7 at 29%.
Chatbot Customer Experience Statistics
What Customers Expect From Chatbots
72. 74% of consumers now expect 24/7 service because of AI, 88% expect faster response times than a year ago, and 95% expect an explanation for decisions made by AI, per Zendesk‘s CX Trends 2026, which surveyed 6,182 consumers and 5,115 business respondents across 22 countries in June 2025.
73. 83% of CX leaders say memory-rich AI agents are key to personalized customer journeys. (Zendesk)
74. 54% of consumers want to know when they are talking to AI rather than a human, and 55% say they are tired of hearing about AI, from Twilio‘s survey of more than 7,600 consumers and 600 business leaders across 18 countries in early 2025.
75. 75% of brands using AI report increased customer spend. (Twilio)
76. 82% of customers expect immediate problem resolution from customer service agents. (HubSpot)
Customer Satisfaction With Chatbots
77. 75% of users are satisfied with their most recent chatbot interaction, more than 70% had their issue completely resolved, and about 30% still prefer waiting for a human even when a chatbot is available, from Tidio‘s survey of more than 1,000 internet users and 300 business owners.
78. Only 8% of customers used a chatbot during their most recent customer service interaction, and just 25% of those said they would use that chatbot again, from a Gartner survey of 497 B2B and B2C customers published in June 2023.
79. 66% of chatbot interactions received a one-out-of-five satisfaction rating in a field study of 35,000 customer service chatbot interactions at a telecommunications company, published in the Journal of Marketing and summarized by Harvard Business Review.
80. Nearly 80% of consumers had recently used AI-assisted tools, and over 60% held a positive attitude about AI improving customer experience. (Vonage)
81. In self-service scenarios, 59% of consumers prefer an AI-powered chatbot over a voice virtual agent, which 11% prefer. (Vonage)
Where Chatbots Frustrate Customers
82. 77% of US adults who have used a chatbot agree that customer service chatbots are frustrating, 85% say their problems usually need a live representative, and 88% would rather talk to a person, from Ipsos‘s Consumer Tracker survey of 770 chatbot users fielded in early 2023.
83. 46% of customers need only one or two bad experiences before they leave, and 74% are likely to take their business elsewhere after a poor one. (Vonage)
84. 61% of customers would rather use self-service for simple issues, from Salesforce’s State of the Connected Customer, sixth edition, a double-blind survey of 14,300 consumers and business buyers.
85. 50% of people have concerns about using artificial intelligence, while 60% of business owners believe AI chatbots improve their customers’ experience. (Tidio)
86. Ipsos found AI marketing leaning on demographic stereotypes rather than genuine personalization, and recommends testing models on more than demographic and geographic data.
Chatbot Privacy and Safety Statistics
87. 45% of Americans said companies that own chatbots should never store health information gleaned from them, from Consumer Reports’ November 2023 survey of 2,070 adults.
88. There were 1,802 data compromises in 2022 affecting 422.1 million people, about 40% more than the previous year, per the Identity Theft Resource Center‘s annual data breach report.
89. Threat actors are working to poison, manipulate and exploit generative AI tools, including the large language models behind chatbots, per FS-ISAC‘s annual threat review.
90. Across 152,783 conversation utterances from SimSimi users in eight countries, expressions of sadness or depression appeared in 49.83% of chatbot messages against 7.53% of Twitter posts, in a mixed-methods study by Chin and colleagues published in the Journal of Medical Internet Research.
AI Agents and the Future of Chatbots
AI Agent Adoption Statistics
91. 62% of organizations are at least experimenting with AI agents, though only 23% of those are scaling them. (McKinsey)
92. 73% of customer service organizations will have implemented agent-assist solutions by the end of 2025, yet AI agents still rank outside the top ten customer service technologies by leader ranking, from a Gartner survey of 265 customer service and support leaders fielded April to May 2025.
93. Teams at mature AI deployment report improved metrics at 87%, against 62% across all respondents, and 52% plan to scale AI beyond support in 2026. (Intercom)
Analyst Predictions Through 2030
94. Chatbots will become the primary customer service channel for roughly a quarter of organizations by 2027, per a Gartner prediction published in July 2022. The underlying survey ran to 50 respondents, of whom 54% already used a chatbot, virtual customer assistant or conversational AI platform.
95. 30% of Fortune 500 companies will offer service through only a single AI-enabled channel by 2028. (Gartner)
96. One in four brands will see a 10% increase in successful simple self-service interactions by the end of 2026, and daily agent workloads will drop by an average of one hour, per Forrester‘s 2026 customer service predictions.
97. Only 15% of AI decision makers reported an EBITDA lift for their organization in the past twelve months. (Forrester)
98. 45% of organizations will orchestrate AI agents at scale by 2030, and agentic systems will account for nearly half of all AI spending by 2029, per IDC‘s FutureScape predictions.
99. Google paid $2.7 billion in 2024 for a non-exclusive license to Character.AI’s technology and to hire co-founders Noam Shazeer and Daniel De Freitas along with roughly 30 staff, as reported by the Financial Times. Character.AI kept operating as a separate company. For where the rest of that money went, see our breakdown of AI agent startups and their funding and the Character.AI statistics page.
Key Takeaways
Consumer adoption ran ahead of enterprise deployment, and it still does. Half of US adults use an AI chatbot and 64% of teens do, while 55% of workers rarely or never use one on the job and only 10% of support teams have a mature AI deployment. The market forecasts reflect that split: Grand View Research cut its growth rate from 23.3% to 19.6% while raising the base, because the money is arriving more slowly than the users did.
The satisfaction data is the part most roundups skip. Gartner found 8% of customers used a chatbot in their most recent service interaction and a quarter of those would use it again. Ipsos found 77% call service chatbots frustrating. Salesforce found 90% of service leaders with AI say it improves customer satisfaction. Both sets of numbers are real, measured on different populations: leaders rating their own deployment, and customers rating the ones they meet.
Frequently Asked Questions
How Many People Use Chatbots in 2026?
49% of US adults say they use AI chatbots, and 44% have used ChatGPT specifically, per Pew Research Center’s February 2026 survey of 5,119 adults. Among US teens aged 13 to 17, 64% use AI chatbots and about three in ten use one daily.
How Big Is the Chatbot Market?
Grand View Research forecasts $11.8 billion in 2026, growing to $41.2 billion by 2033 at a 19.6% CAGR. Mordor Intelligence puts 2026 at $11.45 billion on a narrower definition that counts only vendor-sold solutions. The wider conversational AI market, which includes voice assistants, was worth $11.58 billion in 2024.
Do Chatbots Actually Save Money?
Forrester puts the cost of an automated interaction at about a tenth of an agent conversation, and 85% of service professionals say conversational AI cuts costs. Teams using AI agents expect service costs to fall about 20%. The widely quoted $11 billion savings figure is a July 2018 Juniper Research forecast for 2023, and Juniper never published a retrospective check against it.
What Share of the Chatbot Market Does ChatGPT Hold?
ChatGPT accounted for 77.89% of tracked AI chatbot activity worldwide in July 2026 per Statcounter, ahead of Google Gemini at 9.93% and Perplexity at 5.86%. For the detail behind those platforms, see our OpenAI statistics and Google Gemini statistics pages.
Are Customers Happy With Chatbots?
It depends who is asked and about what. Tidio found 75% satisfied with their most recent chatbot interaction. Gartner found only 25% of the customers who used one would use it again, and Ipsos found 77% describe service chatbots as frustrating. A field study of 35,000 interactions at one telecommunications company found 66% rated one out of five.
Will Chatbots Replace Customer Service Agents?
Not on the current numbers. Gartner expects chatbots to become the primary service channel for roughly a quarter of organizations by 2027, and 30% of Fortune 500 companies to run a single AI-enabled channel by 2028. Forrester expects daily agent workloads to fall by about an hour rather than disappear.
Sources and Methodology
Every statistic on this page traces to a named report, survey, press release or filing. Population-level consumer data comes from probability-sampled surveys by Pew Research Center and from Consumer Reports’ NORC AmeriSpeak panel, which disclose sample sizes and margins of error. Enterprise and customer experience data comes from large multi-country surveys by Salesforce, Zendesk, Twilio, Intercom, HubSpot, IBM, McKinsey, Deloitte and Genesys; each is vendor-sponsored, and each sample skews toward organizations already invested in the technology. Market sizing comes from Grand View Research, Mordor Intelligence and Juniper Research, whose models use different definitions, which is why their headline figures differ by billions while describing the same market. Platform figures from Drift, Freshworks, LivePerson and Statcounter are behavioral rather than survey data, and reflect that platform’s own users.
Figures from 2018 to 2023 are kept where external work cites them, and carry their original date so a forecast is never read as an outcome. Where the publisher has since updated a number, the earlier value stays beside the current one. Analyst predictions are labeled as predictions, with the survey base disclosed where the publisher gave it, including the 50-respondent base behind Gartner’s widely repeated 2027 prediction. Three categories of number were excluded: figures that appear only inside paywalled reports whose public summaries do not carry them, figures attributed to a research firm that repackages other people’s surveys rather than running its own, and figures whose stated source does not contain them. Related reading: how many people use ChatGPT.

About the author
Editorial Staff
The Editorial Staff at Bot Memo is a team of writers, analysts, and AI agents dedicated to mapping the global AI startup ecosystem. Led by Chintan Zalani, the team tracks thousands of funding rounds, classifies companies across verticals, and distills it all into actionable intelligence for investors and founders.