
The United States has 36,207,130 small businesses. They are 99.9% of all US firms, employ 62.3 million people or 45.9% of all US employees, and generate 43.5% of gross domestic product. (SBA Office of Advocacy, February 2026)
On this page
- Key Small Business Statistics For 2026
- How Many Small Businesses Are There In The US?
- Small Business Formation And Survival Statistics
- Small Business Employment And Economic Impact Statistics
- Small Business Revenue, Financing And Credit Statistics
- Small Business AI And Technology Statistics
- Small Business Ownership And Demographics Statistics
- Small Business Challenges, Sentiment And Cybersecurity Statistics
- Small Business Industry And Consumer Statistics
- Key Takeaways
- Frequently Asked Questions
- Sources And Methodology
Key Small Business Statistics For 2026
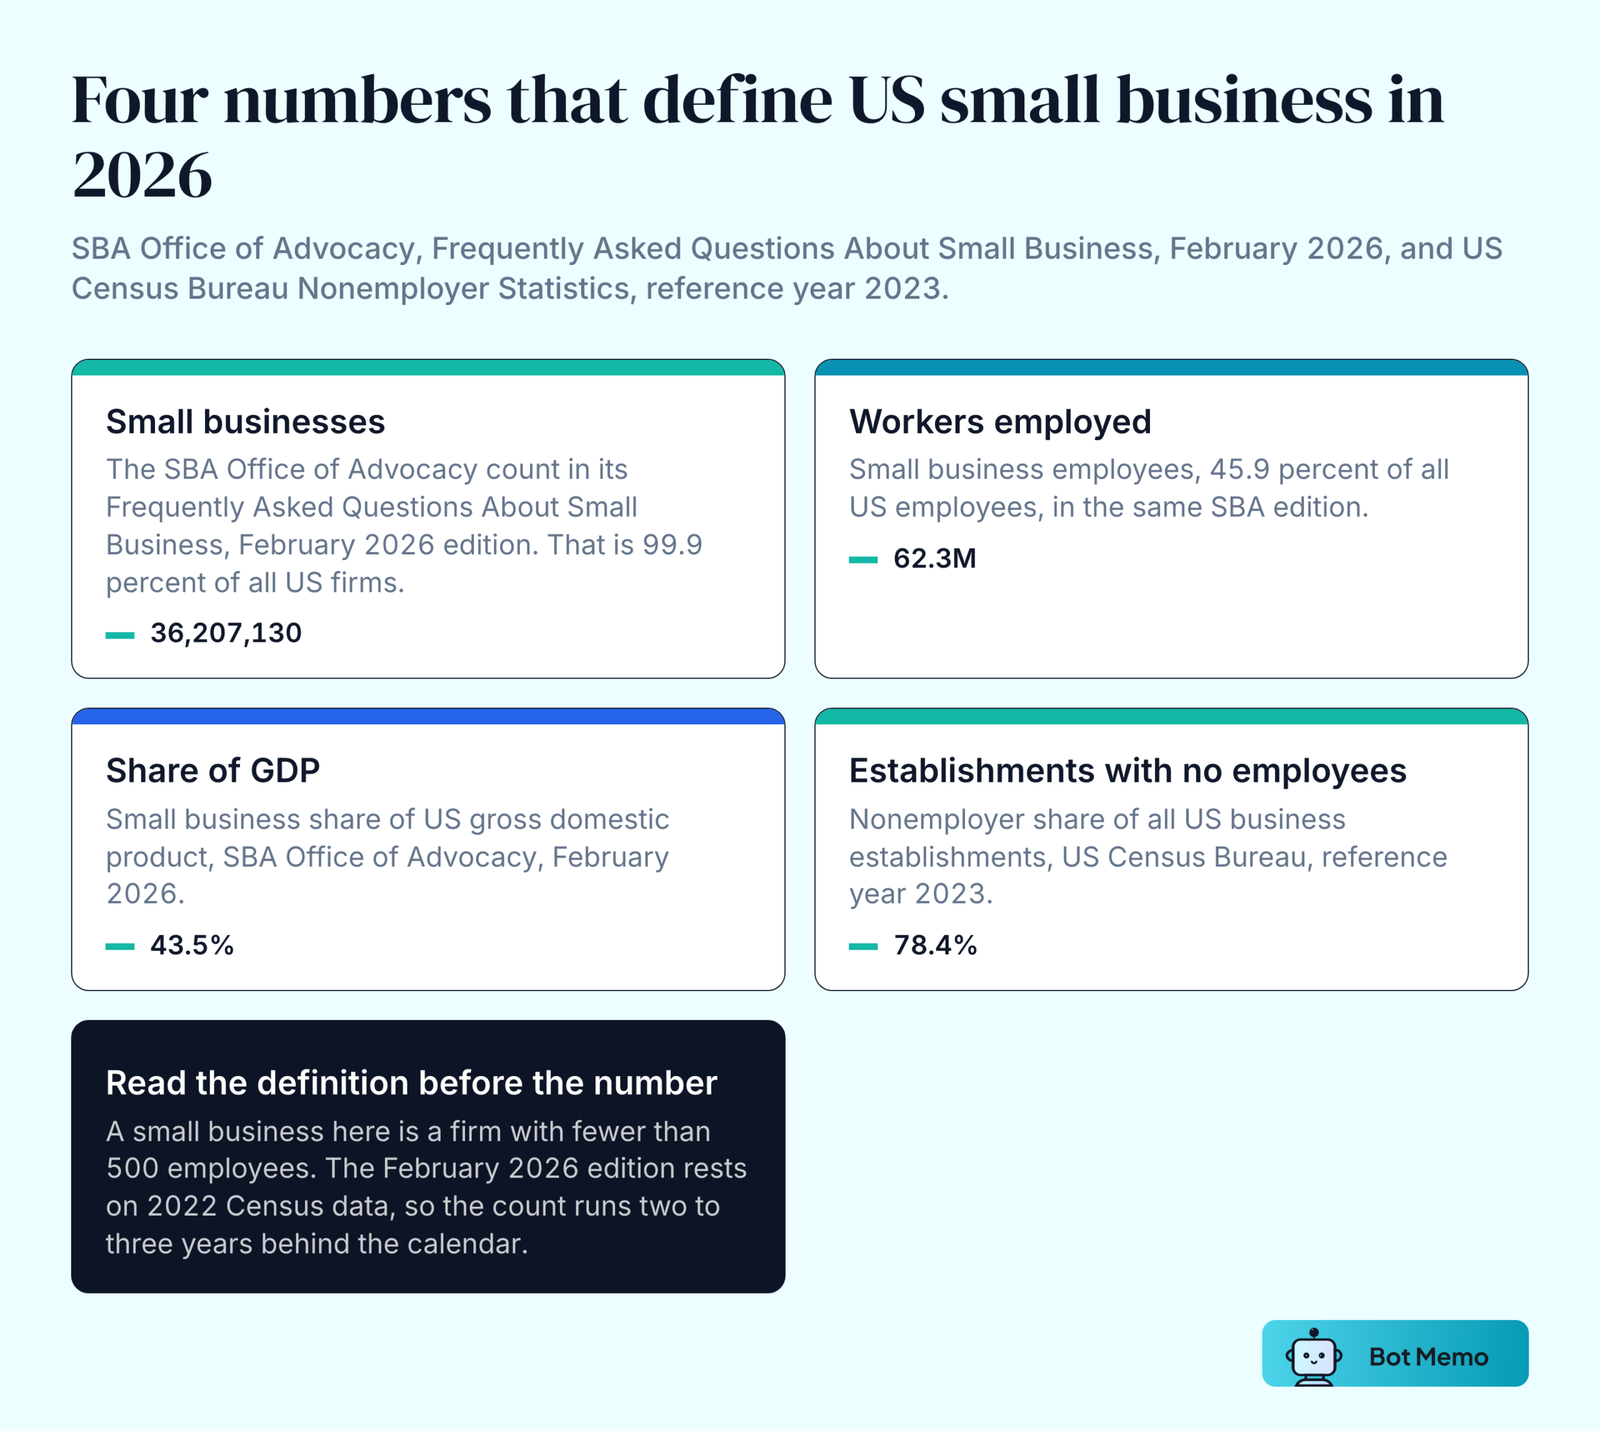
- The United States has 36,207,130 small businesses, which is 99.9% of all US firms. (SBA Office of Advocacy, February 2026)
- Those firms employ 62.3 million workers, or 45.9% of all US employees. (SBA Office of Advocacy, 2025 and 2026 editions)
- Small businesses generate 43.5% of US gross domestic product. (SBA Office of Advocacy, February 2026)
- 78.4% of all US business establishments have no employees at all. (US Census Bureau, reference year 2023)
- 79.6% of establishments survive their first year. 34.7% are still trading after ten. (Bureau of Labor Statistics, 2013 birth cohort)
- 46% of small employer firms say the business or its staff currently use AI, with another 15% planning to start within twelve months. (Federal Reserve Banks, March 2026)
- Only 42% of small employer firms that applied for financing got the full amount they asked for. 22% got nothing. (Federal Reserve Banks, March 2026)
- 578,926 business applications were filed in July 2026, up 8.1% on June. (US Census Bureau, 12 August 2026)
- The NFIB Small Business Optimism Index read 99.8 in July 2026, above its 52-year average of 98.0. (NFIB Research Center, August 2026)
- 71.08% of Americans say they go out of their way to support local businesses. (Red Egg Marketing, 1,653 US adults)
How Many Small Businesses Are There In The US?
The US Has 36,207,130 Small Businesses
1. The Small Business Administration’s Office of Advocacy counts 36,207,130 small businesses in its Frequently Asked Questions About Small Business, published February 2026. (SBA Office of Advocacy)
2. That is 99.9% of all firms in the country.
3. The split is 82.3% nonemployer firms and 17.7% employer firms. (SBA Office of Advocacy, February 2026)
4. Among employer firms alone, small firms are 99.7%, or 6,374,594 businesses. (SBA Office of Advocacy, 2025 Small Business Profile)
33.2 Million In 2023, 36.2 Million In 2026
5. The US Chamber of Commerce has put the count at around 33.2 million small businesses. (US Chamber of Commerce, 2023)
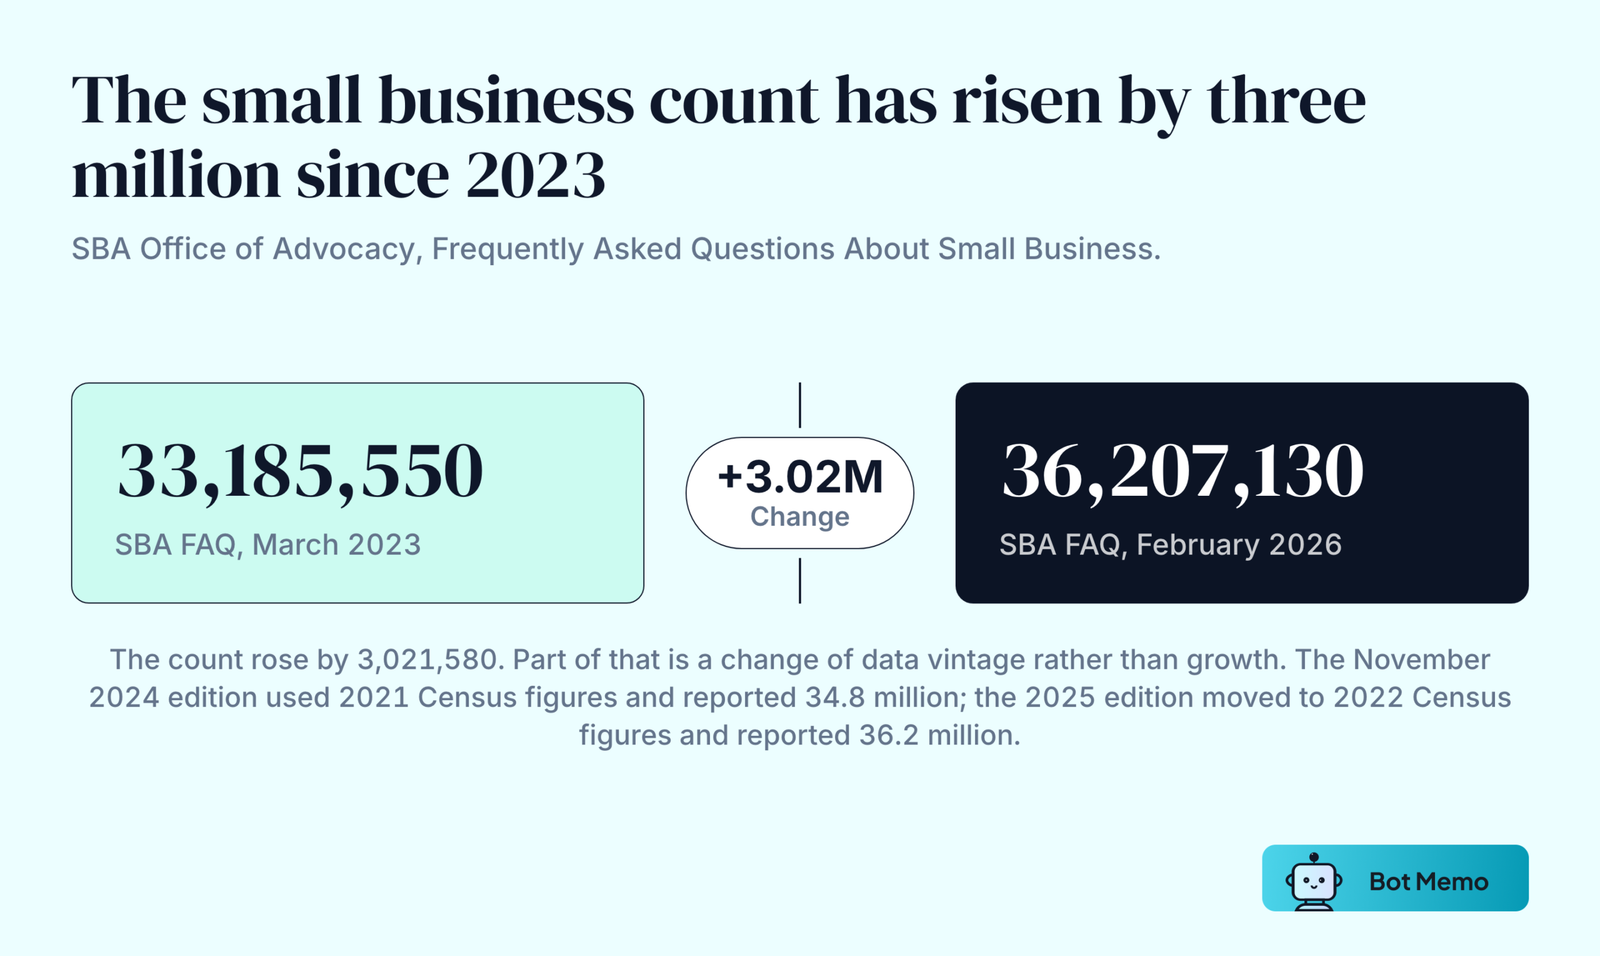
6. That traces back to the March 2023 edition of the same Advocacy publication, which counted 33,185,550 small businesses.
7. The count has since risen to 36,207,130, a rise of 3,021,580 or about 9% across three editions. (SBA Office of Advocacy, February 2026)
8. Part of that jump is a data-vintage change rather than year-over-year growth. The 2024 profile reported 34.8 million small businesses and 59.0 million employees on 2021 Census data; the 2025 edition moved to 2022 Census data and reported 36.2 million and 62.3 million. (SBA Office of Advocacy, United States Small Business Profile 2024)
Most Of Them Have No Employees
9. 81.7%, or 27,104,006 firms, had no employees. (SBA Office of Advocacy, Frequently Asked Questions About Small Business, March 2023)
10. The current Census count is 30,427,808 nonemployer establishments for reference year 2023, up from 29,811,495 in 2022. (US Census Bureau)
11. Those establishments took in roughly $1.8 trillion in receipts, about 6.4% of 2023 GDP.
12. Nonemployers were 78.4% of all US business establishments in 2023. The 82.3% and the older 81.7% are shares of small business firms, a different denominator on a different reference year. (US Census Bureau)
13. Between 2012 and 2023, nonemployers grew an average 2.7% a year against 1.1% for employers. (US Census Bureau, 30 July 2025)
14. The fastest-growing sectors in 2023 were Accommodation and Food Services at +6.4% and Transportation and Warehousing at +5.3%.
15. Taxi and Limousine Service alone added nearly 122,000 nonemployers between 2022 and 2023.
16. Florida has the highest rate per head, at 13.3 nonemployers per 100 people. (US Census Bureau, 2025)
How Small A Small Business Actually Is
17. The Small Business Administration defines a small business here as a firm with fewer than 500 employees.
18. 49% of small employer businesses have just one to four workers. (Pew Research Center, 22 April 2024, on 2021 Census Annual Business Survey data)
19. Small businesses with employees employed an estimated 56.4 million workers in 2021 and brought in over $16.2 trillion in revenue. (Pew Research Center, April 2024, on Census Annual Business Survey data)
20. The Bureau of Economic Analysis notes the country has no single consistent measure of small business activity, which is why the counts on this page differ by source. (BEA)
Small Business Formation And Survival Statistics
Applications Are Running Above Half A Million A Month
21. 578,926 business applications were filed in July 2026, seasonally adjusted, up 8.1% on June. (US Census Bureau, 12 August 2026)
22. Projected business formations within four quarters stood at 29,959, up 0.7% on June.
23. Projected formations within eight quarters stood at 40,777, down 0.7% on June.
24. February 2026 saw 496,443 applications, down 5.8% on January, with projected formations of 28,994. (US Census Bureau, 11 March 2026)
25. Full-year 2025 applications totaled 5,671,836, not seasonally adjusted, up 8.6% on the 5,224,176 filed in 2024. Both totals are sums of the monthly Census series. (US Census Bureau, Business Formation Statistics)
26. Applications are not businesses. Census defines projected business formations within four quarters as the employer businesses expected to originate from that month’s applications, and for July 2026 that projection is 29,959 against 578,926 applications, about 5%. Census publishes both series but no conversion rate, so the 5% is arithmetic on its own published counts, not a Census statistic. (US Census Bureau, Business Formation Statistics definitions)
The COVID-19 Surge Has Not Reversed
27. US business applications ran to 3,498,990 in 2019. In 2020 they hit 4,356,498, up 24.5%, and in 2021 5,390,816, up 54.1% on 2019. Figures are not seasonally adjusted and are summed from the monthly Census Business Formation Statistics series. (US Census Bureau, Business Formation Statistics)
28. Census researchers described the pattern at the time: “After an initial decline, there has been a strong surge in new business applications for both likely employers and nonemployers. For overall applications, 2020 is the highest year on record for new business formations with most of this surge occurring in the second half of 2020.” (US Census Bureau, Center for Economic Studies working paper CES-21-06, March 2021)
29. Applications never fell back. The 2025 total of 5,671,836 sits 62.1% above 2019.
30. The first shock ran the other way. The number of active US business owners fell by 3.3 million, or 22%, between February and April 2020, the largest drop on record. This counts active owners in the Current Population Survey rather than formal closures. (NBER Working Paper 27309, Fairlie, June 2020)
Openings Beat Closings, But Not By Much
31. Between March 2023 and March 2024, 1,281,290 establishments opened and 1,125,979 closed, a net gain of 155,311. (SBA Office of Advocacy, 2025 Small Business Profile)
32. In the first quarter of 2025, gross job gains ran to 7,448,000 against gross job losses of 7,238,000, a net gain of 210,000 jobs. (Bureau of Labor Statistics, Business Employment Dynamics, December 2025)
33. Opening establishments numbered 328,000 in that quarter and created roughly 1.0 million jobs.
34. Firms with 1 to 49 employees added a net 88,000 jobs in the quarter.
79.6% Survive One Year, 34.7% Survive Ten
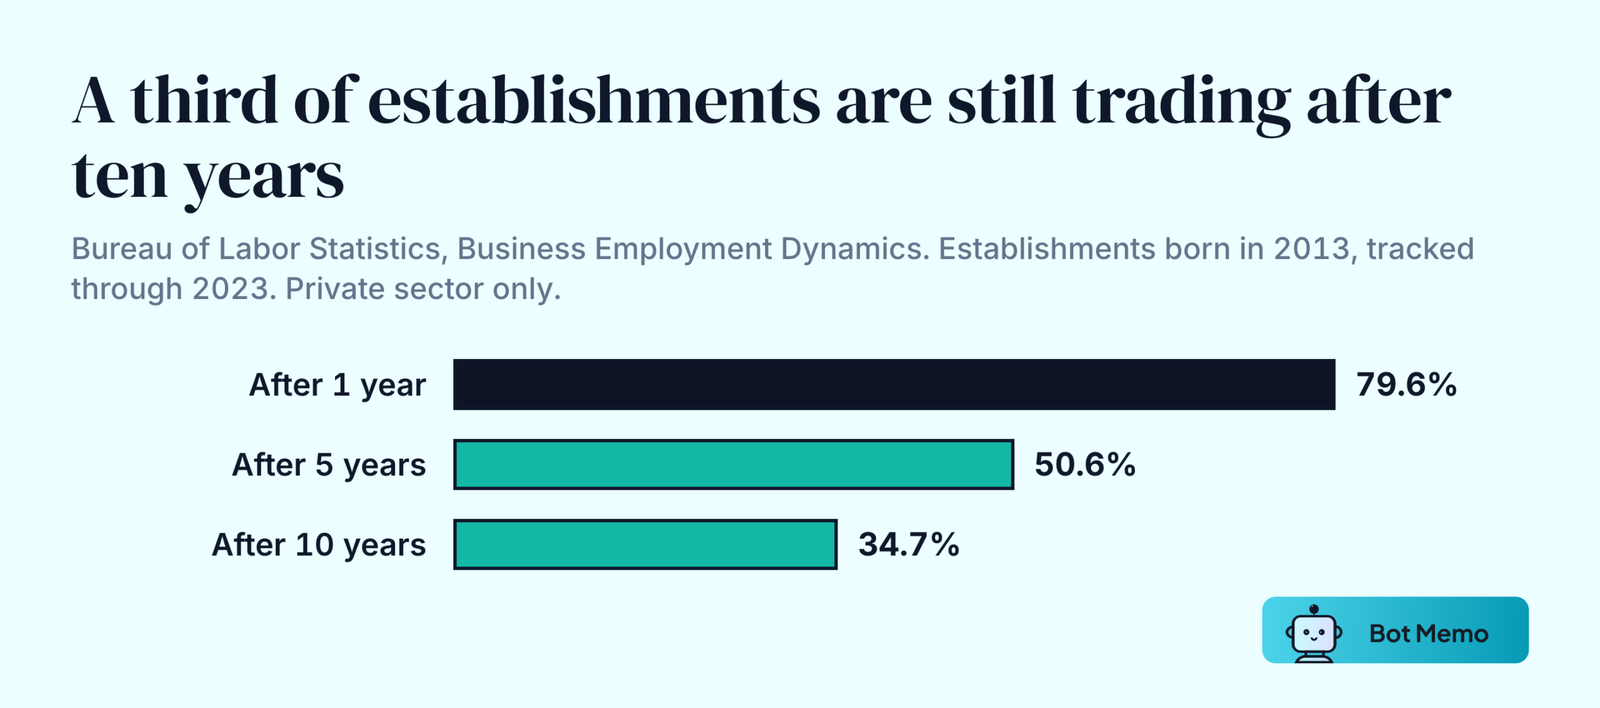
35. 79.6% of establishments born in 2013 were still operating a year later. (Bureau of Labor Statistics)
36. 50.6% made it to five years.
37. 34.7% were still operating in 2023, ten years on. (Bureau of Labor Statistics, 12 January 2024)
38. The steepest fall is year one, a drop of 20.4 percentage points.
39. At the ten-year mark, agriculture leads at 50.5% survival and mining trails at 24.5%.
40. A correction on a widely repeated pair of figures. Around 20% of establishments fail in the first year, which lines up with the BLS series above. The companion claim of 10.7% failing after two to four years appears nowhere in the BLS age tables, so cite the survival percentages above instead.
Small Business Employment And Economic Impact Statistics
Small Firms Employ 62.3 Million People
41. Small businesses employ 62,250,556 workers, or 45.9% of all US employees. (SBA Office of Advocacy, 2025 Small Business Profile)
42. The same 45.9% share holds in the February 2026 edition, which runs on the same 2022 Census vintage.
43. Firms with 249 or fewer employees made up 99% of the 5.6 million firms covered by unemployment insurance in the first quarter of 2023. (Bureau of Labor Statistics, May 2024)
They Made 88.9% Of Net New Jobs
44. Small businesses contributed a net 1.2 million jobs, or 88.9% of the total net increase of 1.4 million. (SBA Office of Advocacy, 2025 Small Business Profile)
45. Across 2013 to 2023, small businesses contributed 55% of total net job creation. (Bureau of Labor Statistics, 1 May 2024)
46. Over the same decade they employed an average 46% of the covered workforce.
Share Of GDP And Exports
47. Small businesses generate 43.5% of US GDP. (SBA Office of Advocacy, February 2026)
48. Speaking at a National Small Business Week event on 1 May 2023, President Biden put the share at 40%: “you small-business owners, you account for 40 percent, let me say it again, 40 percent of the gross domestic product of America.” (The White House, 1 May 2023)
49. An older Advocacy figure puts it at more than 44% of US economic activity. That headline comes from a release of 30 January 2019 reporting 2014 data, not a 2023 measurement. (SBA Office of Advocacy, 30 January 2019)
50. Since the late 1990s, small businesses have accounted for between 43.5% and 50.7% of US gross domestic output. (US Chamber of Commerce)
51. Small firms exported $588.4 billion in goods, 33.0% of the export value from identified firms. (SBA Office of Advocacy, 2025 Small Business Profile)
The Hiring Gap Has Closed, The Skills Gap Has Not
52. The US Chamber of Commerce states there are 8.5 million open jobs but only 6.5 million unemployed workers to fill them. (US Chamber of Commerce, 2023)
53. That gap has closed. In June 2026 there were 1.0 unemployed people per job opening, with 7.359 million openings against roughly 7.1 million unemployed. (Bureau of Labor Statistics, 4 August 2026)
54. 33% of NFIB members reported unfilled job openings in February 2026, and a net 12% planned new hires, the lowest since May 2025. (NFIB Research Center)
55. 46% of the firms that were hiring found few or no qualified applicants. (NFIB Research Center, February 2026)
Small Business Revenue, Financing And Credit Statistics
Applications, Approvals And Rejections
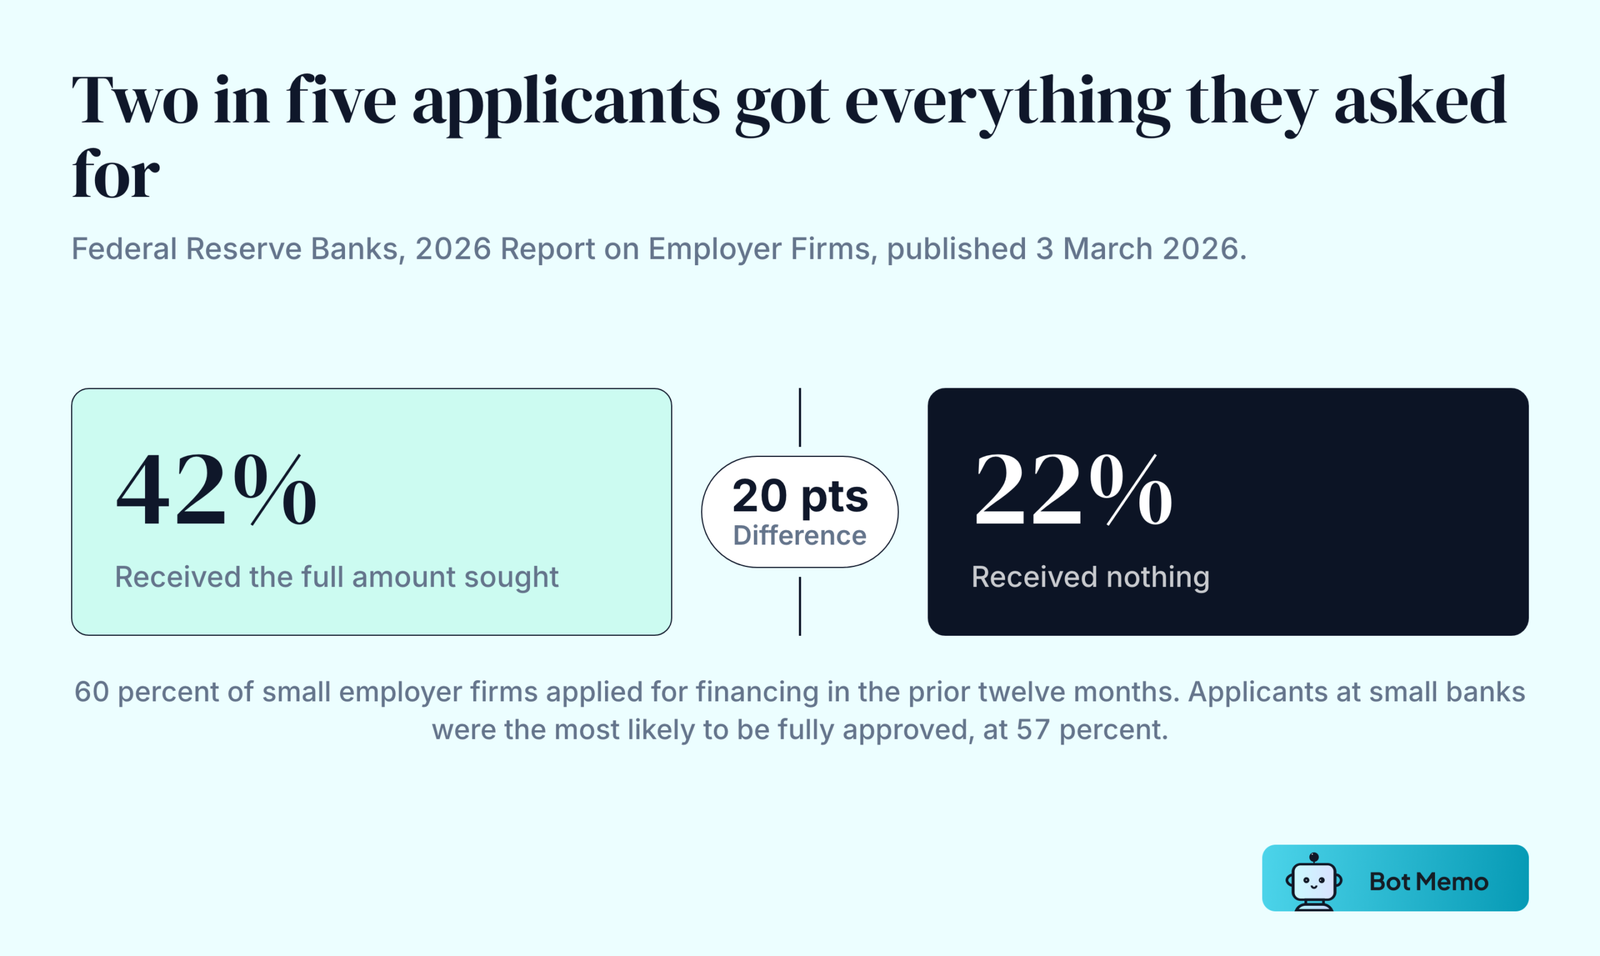
56. 60% of small employer firms applied for financing in the previous twelve months. (Federal Reserve Banks, 3 March 2026)
57. 42% of applicants received the full amount they sought.
58. 22% received nothing at all, a 20-point gap against the fully approved share.
59. Applicants at small banks were the most likely to be fully approved, at 57%.
60. 31% of small employer firms carry no outstanding debt, up from 21% in the 2020 survey.
Online Lenders Now Take 29% Of Applicants
61. The share of applicants going to online fintech lenders rose from 17% in 2020 to 29% in 2025, a fifth straight year of growth. (Federal Reserve Banks, March 2026)
62. 60% of firms that borrowed from an online lender reported higher borrowing costs than expected.
63. The revenue expectations index fell six points to 33 and the employment expectations index fell three points to 23, both the lowest since the 2020 survey.
Revenue And Owner Pay
64. Small businesses tracked by Intuit employed 12,791,800 people in July 2026, down 14,400 on the month. (Intuit QuickBooks Small Business Index, 3 August 2026)
65. Average real monthly revenue per business was $52,440 in July 2026, up 0.66% on June. The index tracks about 420,000 US businesses with one to nine employees.
66. In the year to October 2024, that same index recorded a decline of 51,200 jobs and an average real revenue drop of $11,850 per business. (Intuit QuickBooks Small Business Index Annual Report 2025)
67. The average base salary for a small business owner is $76,498, read on 27 August 2026 from 252 self-reported profiles, with a range running from about $36,000 at the tenth percentile to $181,000 at the ninetieth. An earlier reading of the same page gave $69,838 for 2024, on a $31,000 to $150,000 range. (PayScale)
68. Square processed $250 billion in gross payment volume across more than 4.5 million sellers and 5.9 billion transactions in FY2025, up from $228 billion, 4 million sellers and 5.2 billion transactions in FY2024. Square’s seller base runs from sole proprietors to large merchants, so this is not a small-business-only figure. (Block, Inc., Form 10-K)
Small Business AI And Technology Statistics
Adoption Runs From 8.8% To 58% Depending On The Question
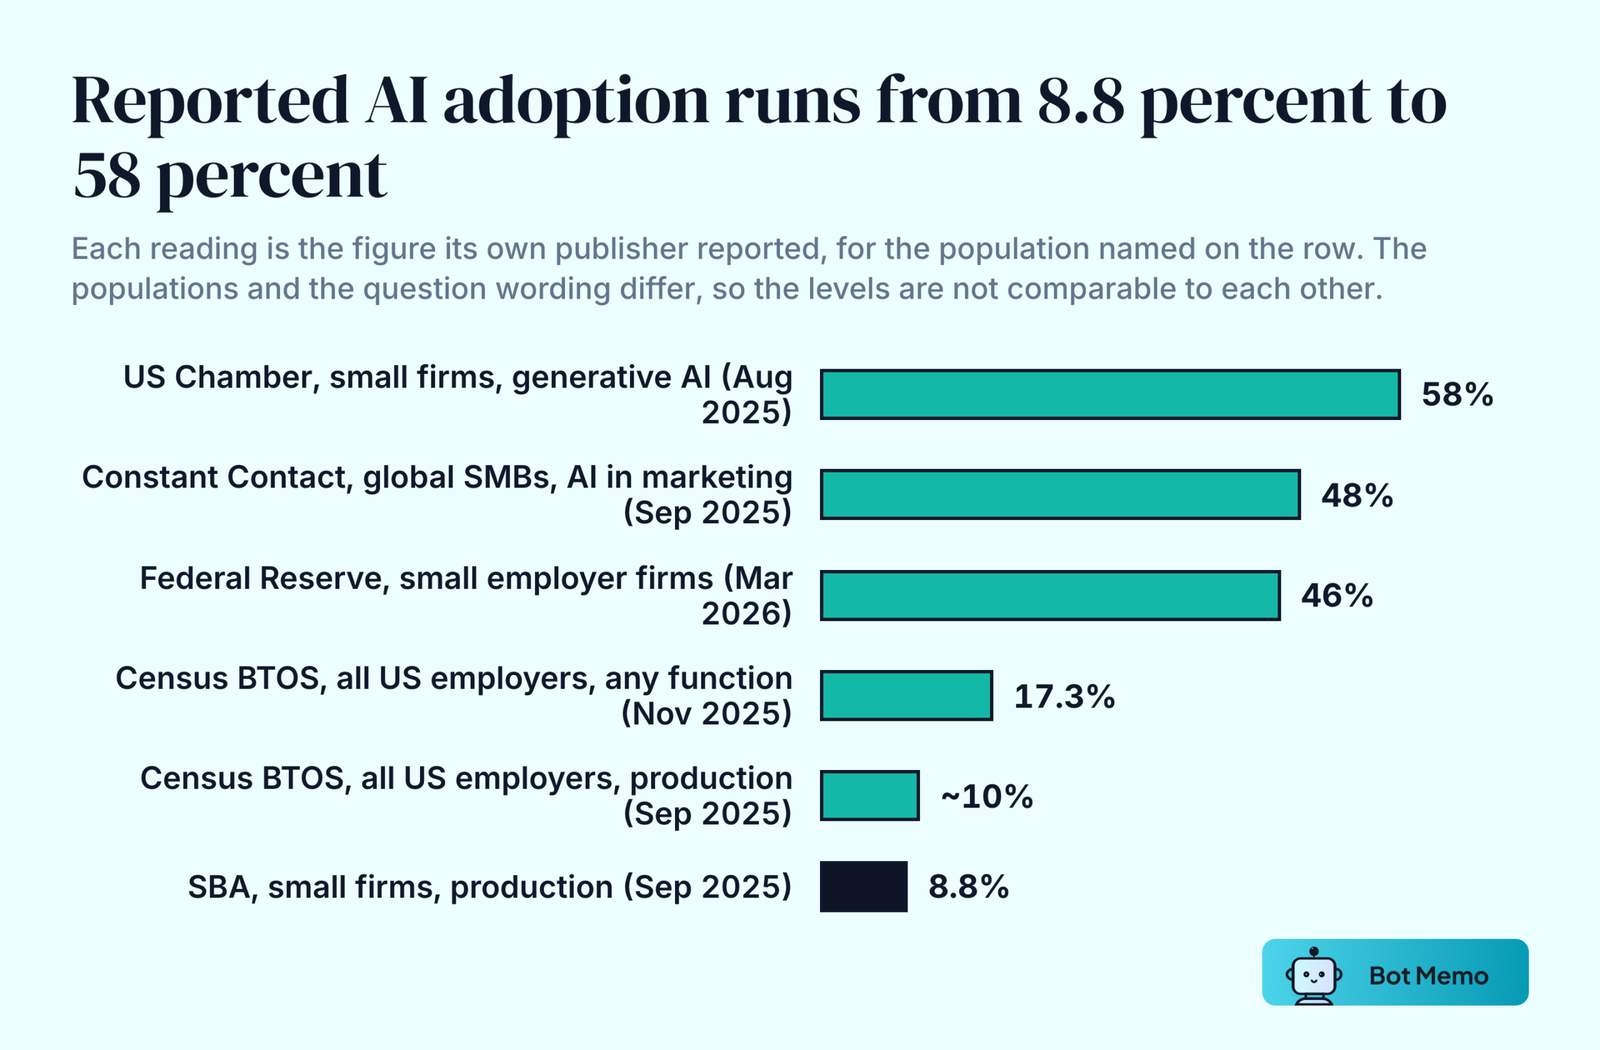
69. The Census Bureau’s Business Trends and Outlook Survey put AI use in the production of goods and services at about 10% across all firms by September 2025. It surveys roughly 200,000 businesses every two weeks and is representative of all US employers.
70. After the question broadened to AI used for any business function in November 2025, the reading was 17.3%.
71. Across the December 2025 to May 2026 collection window, overall AI use ran 17% to 20%, with 20% to 23% of businesses expecting to use AI within six months. (US Census Bureau, 26 May 2026)
72. Size drives most of the gap. For the period ending 3 May 2026, AI use was 37% at firms with 250 or more employees and 32% at firms with 100 to 249, while less than 20% of firms with four or fewer employees reported using AI.
73. Under the strict production definition, use at firms with fewer than 250 employees rose from 6.3% to 8.8% in six months, while large-firm use started the same window at 11.1% and edged down. (SBA Office of Advocacy, 24 September 2025)
74. 46% of small employer firms told the Federal Reserve Banks they currently use AI, with another 15% planning to start within twelve months. (Federal Reserve Banks, March 2026, 6,525 responses)
75. 48% of small and mid-sized businesses globally use AI in marketing. (Constant Contact and Ascend2, 3 September 2025, 2,500 decision-makers)
76. 58% of small businesses say they use generative AI, up from 40% in 2024 and 23% in 2023. (US Chamber of Commerce Technology Engagement Center and Teneo Research, 18 August 2025, 3,870 firms under 250 employees)
77. The spread from 8.8% to 58% is a question-wording spread, not a disagreement about reality. Census asks about AI in production and reaches a representative sample; trade bodies and vendors ask a looser question of a more engaged panel. The same gap shows up in the wider economy, which we cover in how many companies use AI.
What Small Businesses Use AI For
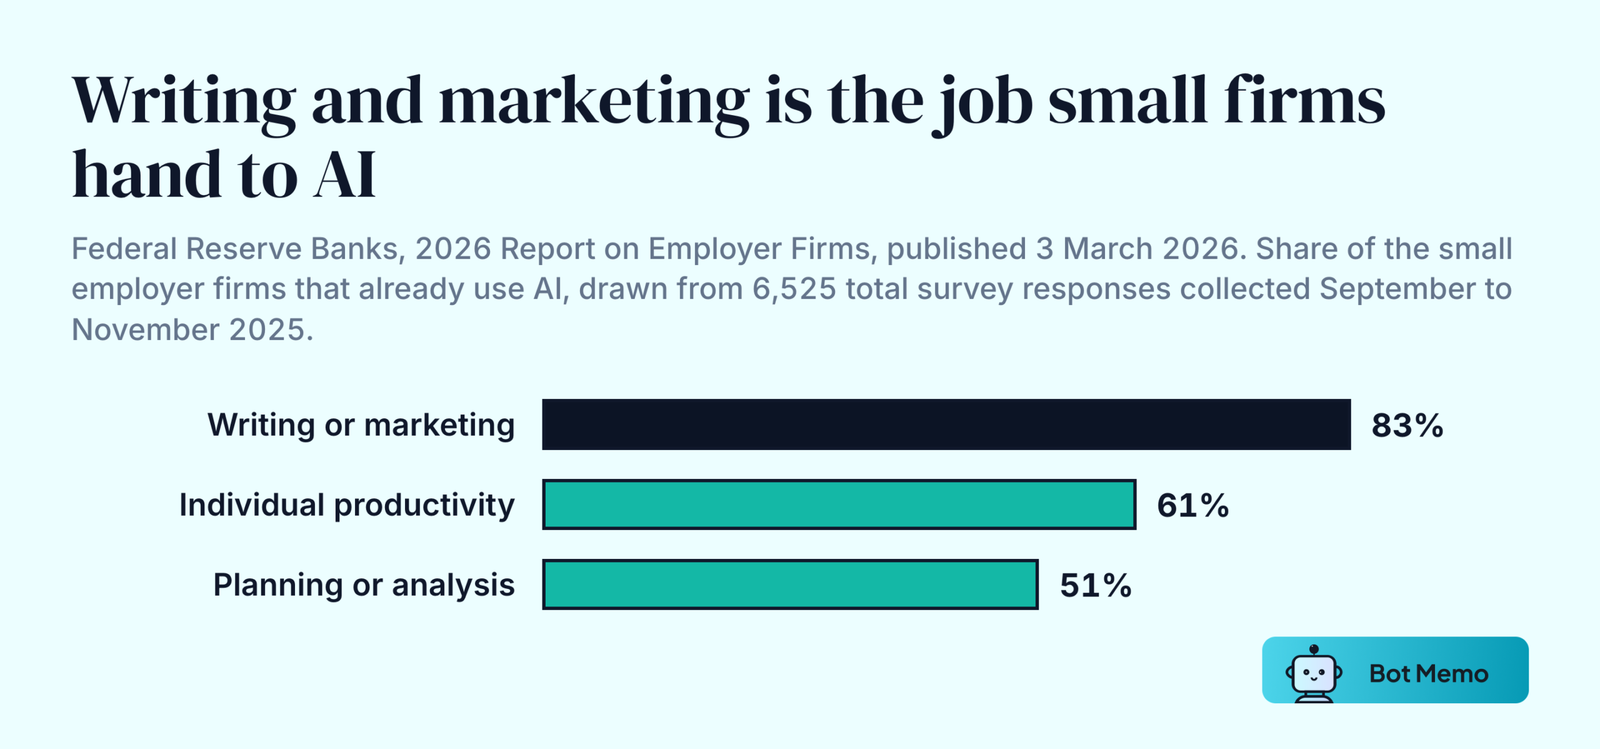
78. Among firms that use AI, 83% use it for writing or marketing, 61% for individual productivity and 51% for planning or analysis. (Federal Reserve Banks, March 2026)
79. 71% of AI users said it raised productivity, 39% said it improved the quality of goods and services and 31% reported higher sales.
80. In marketing specifically, the top uses are writing copy for email and social at 37%, creating visual content at 29% and analyzing data at 25%. (Constant Contact and Ascend2, September 2025) More detail on that split sits in our AI marketing statistics.
81. The top worries are data privacy at 35% and trust in AI-generated content at 31%.
82. 82% of small businesses using AI increased their workforce over the past year, and 80% believe AI will help their business. (US Chamber of Commerce, August 2025)
83. 95% expect difficulty complying with AI regulation, and fewer than one in three feel well prepared for proposed AI laws.
84. 61% of small businesses that use AI deploy it to automate daily tasks, and 96% of firms already using AI say it helps them get routine tasks done faster. (2024 survey of small and mid-sized business AI use)
85. More than half of small and mid-sized businesses with growing revenues use AI in some way, against about one third of small businesses overall. (2024 study of AI usage among small and mid-sized businesses)
What The Research Finds About Productivity
86. A study of 5,179 customer support agents at a firm serving US small business owners found AI raised productivity 14% on average and 34% for novice workers. (NBER Working Paper 31161, Brynjolfsson, Li and Raymond, April 2023)
87. Access to the AI tool cut the monthly likelihood of a worker leaving by 8.6 percentage points.
88. A survey of nearly 6,000 senior executives at firms of all sizes across the US, UK, Germany and Australia found 69% of firms actively use AI. (NBER Working Paper 34836, Yotzov, Barrero, Bloom and co-authors, February 2026)
89. Nine in ten of those executives reported no impact on employment or productivity from AI over the previous three years.
90. The same firms predict a 1.4% productivity gain over the next three years, alongside 0.8% higher output and 0.7% lower employment. The venture side of that story sits in our AI startup statistics.
Small Business Ownership And Demographics Statistics
Two different universes are counted below and they never agree. Census Annual Business Survey shares cover employer firms only. SBA Office of Advocacy shares cover all businesses including nonemployers, and run one data year behind. Each figure names its own universe and vintage.
Women-Owned Businesses
91. 61% of small employer businesses were majority-owned by men in 2021, 22% were majority-owned by women and 14% were owned equally by men and women. (Pew Research Center, April 2024, on 2021 Census data)
92. Women owned 1.4 million employer firms, 22.9% of the roughly 5.9 million total. (US Census Bureau, 20 November 2025, reference year 2023)
93. Among nonemployers, women owned 12.9 million firms, 42.3%, with $423.1 billion in receipts. (US Census Bureau, reference year 2023)
94. Census puts the combined total at 14.2 million women-owned US businesses with $2.8 trillion in receipts. The employer and nonemployer counts above are each rounded, so they do not add to that total exactly. (US Census Bureau, reference year 2023)
95. Women made up 46.9% of workers and owned 44.6% of businesses. (SBA Office of Advocacy, 2025 Small Business Profile, on 2022 data)
Black-Owned Businesses
96. Black or African American-owned firms accounted for 3.4%, or 201,000, of employer businesses, with receipts of $249.0 billion. (US Census Bureau, reference year 2023, published 20 November 2025)
97. Among nonemployers the share is far higher: 14.4%, or 4.4 million firms, with receipts of $128.7 billion. (US Census Bureau, reference year 2023)
98. The gap between those two shares is the story. Black-owned businesses are four times more common among firms with no employees than among firms with payroll.
Hispanic-Owned Businesses
99. Hispanic-owned firms accounted for 8.4%, or 496,000, of employer businesses, with receipts of $730.3 billion. (US Census Bureau, reference year 2023)
100. Hispanics made up 18.1% of workers and owned 16.5% of businesses across the wider all-business universe. (SBA Office of Advocacy, 2025 Small Business Profile, on 2022 data)
101. Across employer and nonemployer firms combined, nearly 5 million Hispanic-owned businesses generate more than $800 billion for the American economy each year, a figure the Small Business Administration attributes to the Joint Economic Committee’s Hispanic Entrepreneurship and Business Brief. (US SBA, September 2023)
102. Around one in four new businesses is Hispanic-owned. (US SBA, 2023)
Veteran-Owned And Asian-Owned Businesses
103. Veterans owned 261,000 employer firms, 4.4% of the total, and 1.4 million nonemployer firms, 4.5%, with $65.7 billion in nonemployer receipts. (US Census Bureau, reference year 2023)
104. Veterans made up 4.3% of workers and owned 5.3% of businesses across the all-business universe. (SBA Office of Advocacy, 2025 Small Business Profile, on 2022 data)
105. Asian-owned firms accounted for 11.5%, or 685,000, of employer businesses, with receipts of $1.2 trillion. (US Census Bureau, reference year 2023)
106. White-owned firms accounted for 80.6%, or 4.8 million, of employer businesses, with receipts of $17.0 trillion. Ownership shares include equal and majority ownership, so they do not sum to 100%. (US Census Bureau, reference year 2023)
107. The denominator for all of the Census shares above is 36.4 million US employer and nonemployer businesses with $50.0 trillion in receipts in 2023, a wider universe than the SBA small business count. (US Census Bureau, 20 November 2025)
Small Business Challenges, Sentiment And Cybersecurity Statistics
Costs, Tariffs And Weak Sales
108. 77% of firms reported challenges from rising costs of goods, services and wages in the 2023 survey, down from 81% in 2022. (Federal Reserve Banks, 2024 Report on Employer Firms)
109. 77% again reported rising costs, tariffs or both in the 2025 survey. The definition is broader in this edition, so the two are not a clean like-for-like trend. (Federal Reserve Banks, March 2026)
110. 44% cited weak sales as a financial challenge. (Federal Reserve Banks, 2024 Report on Employer Firms, 6,103 responses)
111. 29% cited credit availability, and around 23% had a delayed payment or a default due to insufficient funds. (Federal Reserve, 2024)
112. Taxes were the single most-cited problem at 19%, followed by labor quality at 15% and inflation at 12%. (NFIB Research Center, February 2026)
Optimism Is Back Above The 52-Year Average
113. The NFIB Small Business Optimism Index fell 0.9 of a point in March 2024 to 88.5, its lowest level since December 2012, the 27th consecutive month below what was then a 50-year average of 98. (NFIB, April 2024)
114. The index has recovered. July 2026 read 99.8, up 2.4 points on June and the highest since August 2025. (NFIB Research Center)
115. That sits above the 52-year average of 98.0.
116. In February 2026 the index read 98.8 and the Uncertainty Index fell three points to 88. (NFIB Research Center)
117. A net 34% of NFIB members reported raising compensation in February 2026, the highest since March 2025, while a net 24% raised selling prices. (NFIB Research Center)
Cybersecurity
The research below covers organizations of all sizes worldwide, not small businesses alone. Our AI cybersecurity statistics page tracks the same ground from the attacker-tooling side.
118. 68% of breaches involve a non-malicious human element, someone making a mistake or falling for an attack. (Verizon Data Breach Investigations Report, 2024 edition, 30,458 incidents and 10,626 confirmed breaches)
119. In the 2026 edition, covering November 2024 to October 2025 and more than 22,000 confirmed breaches, the human element figure is 62%. (Verizon, May 2026)
120. The median loss per breach is $46,000, and 62% of financially motivated breaches involved ransomware or extortion. The loss figure comes from FBI Internet Crime Complaint Center data on ransomware and extortion breaches, where 95% of cases fall between $3 and $1,141,467. (Verizon, 2024 edition)
121. The 2026 edition puts ransomware in 48% of all breaches, up from 44%, with a median ransom payment of $139,875 and 69% of victims refusing to pay. (Verizon, May 2026)
122. Organizations that tie cybersecurity to business objectives are 18% more likely to hit target revenue growth, market share and customer satisfaction together. (Accenture State of Cybersecurity Resilience 2023, 3,000 executives)
123. Cyber transformers are 5.8x, which the same report describes as nearly six times, more likely to have effective digital transformations. (Accenture, 2023)
Small Business Industry And Consumer Statistics
Small Firms Are 99% Of Establishments In Every Sector
124. Across the ten private-sector groups the Bureau of Labor Statistics publishes for March 2025, 11,515,330 of 11,533,942 establishments, or 99.84%, have fewer than 500 employees. Only 18,612 have 500 or more. (Bureau of Labor Statistics; BLS publishes the counts by size band, and the shares here are calculated from them)
125. No sector is an exception. Manufacturing is the least small-dominated at 99.21% and other services the most at 99.98%, with trade, transportation and utilities and financial activities both at 99.86% and information at 99.79%.
126. The variation that matters is how small. 66.8% of those 11.5 million establishments have fewer than five employees, from 78.0% in information down to 38.3% in leisure and hospitality, where staffing floors are higher. Sector-level founding conditions are covered in our guide to the best industries to start a business in.
127. Businesses with 5 to 9 employees received more patents per employee than any other size band, and nearly double the patents received by large businesses in 2016. (US Chamber of Commerce)
128. Micro-employers with 1 to 4 people accounted for 10% of the patent applications in that dataset. (US Chamber of Commerce)
What Consumers Say About Local Business
The figures in this section come from a survey of 1,653 US adults over 18. The percentages are published in the study’s charts rather than its prose, which rounds most of them to “seven in ten” and similar. (Red Egg Marketing)
129. 93.20% of Americans say they have bought a product from a local business.
130. 71.08% say they go out of their way to support local businesses.
131. 54.81% shop locally at least once a month, and 33.15% shop locally weekly.
132. 77.19% shop locally to support local businesses, the most-cited reason of any.
133. 54.39% say local products are better quality, and 30.85% say they are more accessible.
134. 71.26% research a brand before making a purchase from it.
135. 82.76% would rather buy from a local business than a national brand when the options are otherwise similar.
136. 83.91% would spend more money if it went to a local shop.
137. 67.51% collect information about a brand from the business’s own website, ahead of social media at 39.02% and prices at 38.78%.
The Online Experience Gap
138. 91% of US small businesses feel they offer customers a convenient online experience. (GoDaddy, 2023, 1,000 respondents)
139. Only 21% of consumers and 19% of Gen Z agree.
Key Takeaways
- The headline count is 36,207,130 small businesses, but 82.3% of them have no employees. Any statement about small business payroll or hiring is really about the 17.7% that do. The other 82.3% still turned over about $1.8 trillion.
- The 43.5% GDP share and the older 44% figure both come from the SBA Office of Advocacy. The first is current, the second reports 2014 data.
- Survival is the number most often mangled. BLS tracks 79.6% at one year, 50.6% at five and 34.7% at ten for the 2013 cohort.
- AI adoption readings run from 8.8% to 58%. Census asks about AI in production of goods and services across all US employers; trade bodies and vendors ask about any use, of a more engaged panel, and the 48% marketing reading is global rather than US-only.
- Ownership shares split hard by universe. Black-owned firms are 3.4% of employer businesses but 14.4% of nonemployers; women own 22.9% of employer firms but 42.3% of nonemployers.
- The COVID-19 application surge stuck. Business applications went from 3,498,990 in 2019 to 5,390,816 in 2021, and 2025 came in at 5,671,836, still 62.1% above 2019.
- The hiring crunch that defined 2022 and 2023 has eased to 1.0 unemployed person per job opening, but 33% of small firms still report unfilled openings and 46% of those hiring find few or no qualified applicants.
- Credit is where the pressure sits. 60% of small employer firms applied for financing, 42% of applicants got everything they asked for and 22% got nothing. (Federal Reserve Banks, March 2026)
Frequently Asked Questions
How Many Small Businesses Are There In The US?
36,207,130, per the SBA Office of Advocacy’s February 2026 edition. That is 99.9% of all US firms. The count sits on 2022 Census data, so it lags the calendar by two to three years.
What Counts As A Small Business?
For the counts on this page, a firm with fewer than 500 employees. The Small Business Administration also maintains industry-specific size standards, keyed to the North American Industry Classification System, that use revenue or employee thresholds instead, and those differ from the 500-employee rule. The Bureau of Economic Analysis notes the country has no single consistent measure.
What Percentage Of Small Businesses Fail?
Of establishments born in 2013, 79.6% were still trading after one year, 50.6% after five and 34.7% after ten. The sharpest drop is the first year, 20.4 percentage points. Agriculture survives best at ten years, 50.5%, and mining worst, 24.5%.
How Many Small Businesses Use AI?
It depends on the question and the population. The Census Bureau, surveying about 200,000 US employers every two weeks, found overall AI use of 17% to 20% between December 2025 and May 2026 for any business function, and about 10% under the narrower production definition. Under that narrow definition, firms with fewer than 250 employees were at 8.8% in September 2025. The Federal Reserve Banks put current use at 46% of small employer firms and the US Chamber of Commerce at 58% for generative AI.
How Many Women-Owned And Black-Owned Businesses Are There?
Women owned 1.4 million employer firms (22.9%) and 12.9 million nonemployer firms (42.3%) in 2023, 14.2 million businesses in total with $2.8 trillion in receipts. Black or African American owners held 201,000 employer firms (3.4%, $249.0 billion in receipts) and 4.4 million nonemployer firms (14.4%, $128.7 billion). Those are Census Annual Business Survey and Nonemployer Statistics by Demographics figures for reference year 2023, published 20 November 2025.
How Are Small Businesses Doing Right Now?
Sentiment has recovered while credit has tightened. The NFIB Small Business Optimism Index read 99.8 in July 2026, above its 52-year average of 98.0. Against that, the Federal Reserve Banks’ revenue and employment expectations indices for small employer firms both fell to their lowest since 2020, and 77% of those firms reported rising costs, tariffs or both.
How Many New Businesses Are Started Each Year?
5,671,836 business applications were filed in 2025, up 8.6% on 2024, and 578,926 in July 2026 alone. Applications are not businesses. Census projects 29,959 employer businesses will form within four quarters from that July cohort, roughly 5% of the applications filed that month.
Sources And Methodology
The counts, employment shares and GDP shares come from the SBA Office of Advocacy, which builds them from Census Statistics of US Businesses, Census Nonemployer Statistics, BLS Business Employment Dynamics, FFIEC CRA data and the Census Annual Business Survey. Its small business definition is a firm with fewer than 500 employees, alongside industry-specific size standards keyed to the North American Industry Classification System. Its core data runs two to three years behind the calendar, so the February 2026 edition rests on 2022 Census figures.
Survival rates come from BLS Business Employment Dynamics, which tracks establishments rather than firms. A multi-location company counts once per location, and the series covers the private sector only. The most recent ten-year cohort is the class of 2013.
Ownership figures come from two sources that measure different populations. Census Annual Business Survey and Nonemployer Statistics by Demographics shares, published 20 November 2025 for reference year 2023, split employer firms from nonemployer firms and never blend them. SBA Office of Advocacy shares cover all businesses together and run on 2022 data. Ownership shares include equal and majority ownership, so they do not sum to 100%.
Financing, credit and AI-use figures for small employer firms come from the 2026 Report on Employer Firms, published 3 March 2026 by the twelve Federal Reserve Banks, drawn from 6,525 responses collected 3 September to 14 November 2025. That survey is a weighted convenience sample rather than a probability sample.
The NFIB Small Business Economic Trends series is a monthly mail survey of NFIB members, 428 usable responses in February 2026 at an 8.6% response rate, unweighted to the general small business population.
AI adoption readings differ by design. The Census Business Trends and Outlook Survey is representative of all US employers and asks a narrow question. Vendor and trade-association surveys ask a broader question of a self-selecting panel. Each reading above carries the population it measures.
Annual business application totals are sums of the twelve monthly figures in the Census Business Formation Statistics series, not seasonally adjusted. Census publishes the monthly counts, not a pre-summed annual total, and publishes no rate at which applications become employer businesses.
The establishment-size shares in the industry section are calculated from BLS counts of establishments by size band for March 2025. BLS publishes the counts, not the percentages.
Research and trade bodies cited above: the US Chamber of Commerce and its Technology Engagement Center with Teneo Research, Pew Research Center, the Bureau of Economic Analysis, the Joint Economic Committee and the National Bureau of Economic Research.
Company and vendor data cited above: Intuit QuickBooks, PayScale, Block Inc. through its Form 10-K, Constant Contact with Ascend2 Research, Verizon Business with FBI Internet Crime Complaint Center loss data, Accenture, Red Egg Marketing and GoDaddy.
Where two editions of the same series exist, both are shown with their own source and year rather than merged.

About the author
Editorial Staff
The Editorial Staff at Bot Memo is a team of writers, analysts, and AI agents dedicated to mapping the global AI startup ecosystem. Led by Chintan Zalani, the team tracks thousands of funding rounds, classifies companies across verticals, and distills it all into actionable intelligence for investors and founders.