
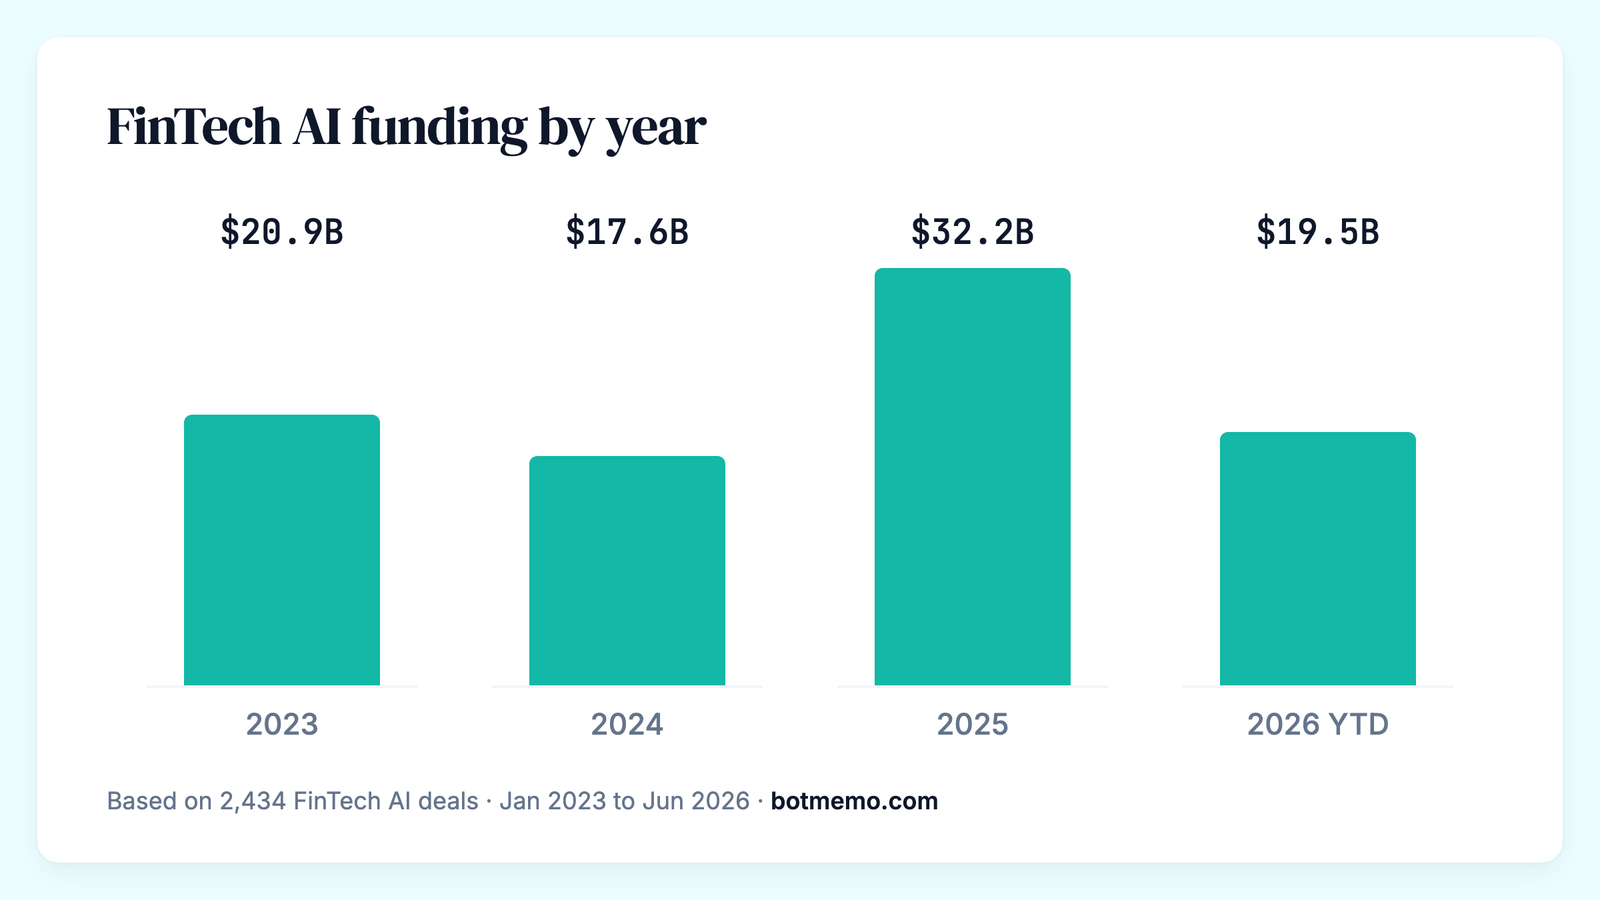
FinTech AI startups raised $90.2B across 2,434 funding rounds between January 2023 and June 2026, 9.9% of all AI venture funding worldwide. Annual FinTech funding climbed from $17.6B in 2024 to $32.2B in 2025. The median round is $12M, and Stripe leads the category with $6.5B raised.
Updated with data through June 2026. Refreshed monthly.
On this page
FinTech AI funding by year
Top FinTech AI startups by total funding
| # | Company | Total raised | Rounds | Latest stage | HQ |
|---|---|---|---|---|---|
| 1 | Stripe | $6.5B | 1 | Series G+ | South San Francisco, United States |
| 2 | Acrisure | $2.1B | 1 | Convertible | Grand Rapids, United States |
| 3 | Ramp | $2.1B | 7 | Series F | New York, United States |
| 4 | Binance | $2.0B | 1 | Debt | George Town, Cayman Islands |
| 5 | Kalshi | $1.2B | 3 | Series E | New York, United States |
| 6 | Airwallex | $1.1B | 4 | Series G+ | San Francisco Bay Area, United States |
| 7 | Abound | $1.0B | 2 | Other | London, United Kingdom |
| 8 | Cred | $915M | 2 | Other | Bangalore, India |
| 9 | AlphaSense | $900M | 3 | Growth | New York, United States |
| 10 | iCapital | $820M | 1 | Debt | New York, United States |
| 11 | Rain | $741M | 4 | Series C | New York, United States |
| 12 | Ebury | $737M | 1 | Growth | London, United Kingdom |
| 13 | DailyPay | $635M | 3 | Debt | New York, United States |
| 14 | Crux | $629M | 6 | Debt | New York, United States |
| 15 | Plaid | $575M | 1 | Other | San Francisco, United States |
FinTech AI rounds by stage
| Stage | Rounds | Funding |
|---|---|---|
| Pre-Seed | 183 | $503M |
| Seed | 684 | $4.6B |
| Series A | 510 | $10.5B |
| Series B | 238 | $10.2B |
| Series C | 95 | $6.7B |
| Series D | 60 | $8.6B |
| Series E | 20 | $2.8B |
| Series F | 5 | $1.3B |
Where FinTech AI funding concentrates
| Metro | Rounds | Funding |
|---|---|---|
| New York City | 415 | $19.0B |
| SF Bay Area | 318 | $17.5B |
| Los Angeles | 39 | $2.1B |
| Miami-South Florida | 46 | $1.3B |
| Austin | 35 | $1.2B |
About this data
Bot Memo tracks AI startup funding rounds worldwide and structures every deal across 18 industry sectors, funding stages, investors, and 700+ cities. Figures on this page cover January 2023 through June 2026 and refresh monthly. Read the full methodology for definitions and coverage.

About the author
Editorial Staff
The Editorial Staff at Bot Memo is a team of writers, analysts, and AI agents dedicated to mapping the global AI startup ecosystem. Led by Chintan Zalani, the team tracks thousands of funding rounds, classifies companies across verticals, and distills it all into actionable intelligence for investors and founders.